


Office space for rent in Europe
There are 129,450 available office spaces in Europe right now. Companyspace.com collects office spaces from many different parts of the market, so that you as a company can more easily get an overview of available office spaces in Europe.
Companyspace.com today:
New today 2,847
Updated 24h 4,321
Notifications about new companyspaces62
Berlin +3
Paris +5
Madrid +1
Dublin (county) +23
Warsaw +19
Greater London +12
Latest update 2 min ago
Active ads 368,936
129,450 office spaces found
Office space in Oldambt, Groningen (region)
 More info
Office space in Oldambt, Groningen (region)
Office space for rent in Oldambt, Groningen (region)
Areal
Ca. 320 m2
Pris pr. md.
Not stated
Område
Oldambt, Groningen (region)
Type
Office space
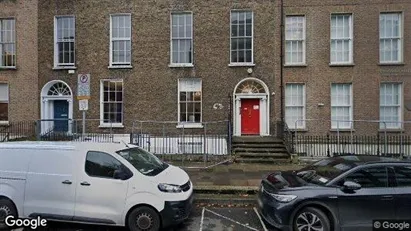
Office space in Dublin 2, Dublin
 More info
Office space in Dublin 2, Dublin
Office space for rent in Dublin 2, Dublin
Areal
Ca. 20 m2
Pris pr. md.
Ca. 1,800 EUR pr md
Område
Dublin 2, Dublin
Type
Office space
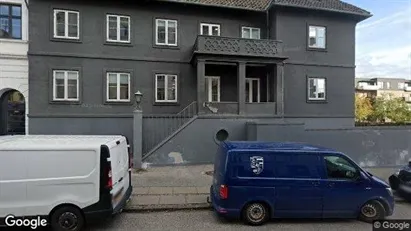
Office space in Hellerup, Greater Copenhagen
 More info
Office space in Hellerup, Greater Copenhagen
Office space for rent in Hellerup, Greater Copenhagen
Areal
Ca. 120 m2
Pris pr. md.
Ca. 18,500 DKK pr md
Område
Hellerup, Greater Copenhagen
Type
Office space
Office space in Dublin 2, Dublin
 More info
Office space in Dublin 2, Dublin
Office space for rent in Dublin 2, Dublin
Areal
Ca. 30 m2
Pris pr. md.
Ca. 1,800 EUR pr md
Område
Dublin 2, Dublin
Type
Office space
Office space in Dublin 12, Dublin
 More info
Office space in Dublin 12, Dublin
Office space for rent in Dublin 12, Dublin
Areal
Ca. 5 m2
Pris pr. md.
Ca. 400 EUR pr md
Område
Dublin 12, Dublin
Type
Office space
Office space in Dublin 2, Dublin
 More info
Office space in Dublin 2, Dublin
Office space for rent in Dublin 2, Dublin
Areal
Ca. 35 m2
Pris pr. md.
Ca. 2,000 EUR pr md
Område
Dublin 2, Dublin
Type
Office space
Office space in Leek, Groningen (region)
 More info
Office space in Leek, Groningen (region)
Office space for rent in Leek, Groningen (region)
Areal
Ca. 630 m2
Pris pr. md.
Not stated
Område
Leek, Groningen (region)
Type
Office space
Office space in Dublin 2, Dublin
 More info
Office space in Dublin 2, Dublin
Office space for rent in Dublin 2, Dublin
Areal
Ca. 50 m2
Pris pr. md.
Ca. 2,400 EUR pr md
Område
Dublin 2, Dublin
Type
Office space
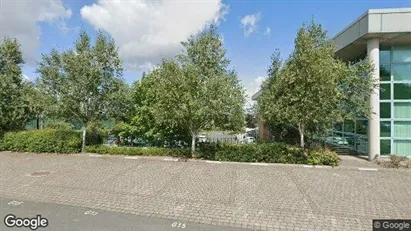
Office space in Dublin 18, Dublin
 More info
Office space in Dublin 18, Dublin
Office space for rent in Dublin 18, Dublin
Areal
Ca. 25 m2
Pris pr. md.
Ca. 1,250 EUR pr md
Område
Dublin 18, Dublin
Type
Office space
Office space in Dublin 2, Dublin
 More info
Office space in Dublin 2, Dublin
Office space for rent in Dublin 2, Dublin
Areal
Ca. 30 m2
Pris pr. md.
Ca. 3,000 EUR pr md
Område
Dublin 2, Dublin
Type
Office space
Office space in Dublin 24, Dublin
 More info
Office space in Dublin 24, Dublin
Office space for rent in Dublin 24, Dublin
Areal
Ca. 20 m2
Pris pr. md.
Ca. 1,600 EUR pr md
Område
Dublin 24, Dublin
Type
Office space
Office space in Heerenveen, Friesland NL
 More info
Office space in Heerenveen, Friesland NL
Office space for rent in Heerenveen, Friesland NL
Areal
Ca. 245 m2
Pris pr. md.
Ca. 750 EUR pr md
Område
Heerenveen, Friesland NL
Type
Office space
Office space in Leek, Groningen (region)
 More info
Office space in Leek, Groningen (region)
Office space for rent in Leek, Groningen (region)
Areal
Ca. 500 m2
Pris pr. md.
Ca. 3,300 EUR pr md
Område
Leek, Groningen (region)
Type
Office space
Office space in Roerdalen, Limburg
 More info
Office space in Roerdalen, Limburg
Kantoor te huur in Roerdalen, Limburg
Areal
-
Pris pr. md.
Ca. 400 EUR pr md
Område
Roerdalen, Limburg
Type
Office space
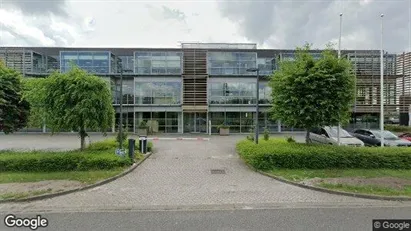
Office space in Amersfoort, Province of Utrecht
 More info
Office space in Amersfoort, Province of Utrecht
Kantoor te huur in Amersfoort, Utrecht-provincie
Areal
Ca. 6,120 m2
Pris pr. md.
Not stated
Område
Amersfoort, Province of Utrecht
Type
Office space
Office space in Dublin 2, Dublin
 More info
Office space in Dublin 2, Dublin
Office space for rent in Dublin 2, Dublin
Areal
Ca. 70 m2
Pris pr. md.
Ca. 5,000 EUR pr md
Område
Dublin 2, Dublin
Type
Office space
Office space in Dublin 24, Dublin
 More info
Office space in Dublin 24, Dublin
Office space for rent in Dublin 24, Dublin
Areal
Ca. 50 m2
Pris pr. md.
Ca. 1,000 EUR pr md
Område
Dublin 24, Dublin
Type
Office space
Office space in Hilversum, North Holland
 More info
Office space in Hilversum, North Holland
Office space for rent in Hilversum, North Holland
Areal
Ca. 340 m2
Pris pr. md.
Ca. 4,500 EUR pr md
Område
Hilversum, North Holland
Type
Office space
Selected customers
30,000 customers use Companyspace.com
30,000 customers
285,000 companies in our database
2,400 rentals annually
Companyspace.com is used by thousands of landlords, property companies, commercial real estate agents, investors and business centres seeking greater visibility, more enquiries and lower vacancy rates.


