


Office space for rent in Europe
There are 129,438 available office spaces in Europe right now. Companyspace.com collects office spaces from many different parts of the market, so that you as a company can more easily get an overview of available office spaces in Europe.
Companyspace.com today:
New today 2,511
Updated 24h 4,188
Notifications about new companyspaces35
Berlin +3
Paris +5
Madrid +1
Dublin (county) +23
Warsaw +19
Greater London +1
Latest update 1 min ago
Active ads 369,026
129,438 office spaces found
Office space in Venray, Limburg
 More info
Office space in Venray, Limburg
Office space for rent in Venray, Limburg
Areal
Ca. 190 m2
Pris pr. md.
Ca. 1,150 EUR pr md
Område
Venray, Limburg
Type
Office space
Office space in Kraków Podgórze, Kraków
 More info
Office space in Kraków Podgórze, Kraków
Office space for rent in Kraków Podgórze, Kraków
Areal
Ca. 800 m2
Pris pr. md.
Ca. 4,300 PLN pr md
Område
Kraków Podgórze, Kraków
Type
Office space
Office space in Borne, Overijssel
 More info
Office space in Borne, Overijssel
Office space for rent in Borne, Overijssel
Areal
1 - 550 m2
Pris pr. md.
Ca. 450 EUR pr md
Område
Borne, Overijssel
Type
Office space
Office space in Brabrand, Aarhus
 More info
Office space in Brabrand, Aarhus
Office space for rent in Brabrand, Aarhus
Areal
Ca. 135 m2
Pris pr. md.
Ca. 11,500 DKK pr md
Område
Brabrand, Aarhus
Type
Office space
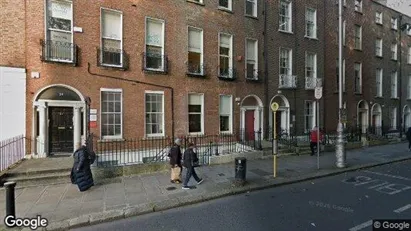
Office space in Dublin 2, Dublin
 More info
Office space in Dublin 2, Dublin
Office space for rent in Dublin 2, Dublin
Areal
Ca. 30 m2
Pris pr. md.
Ca. 2,000 EUR pr md
Område
Dublin 2, Dublin
Type
Office space
Office space in Vejen, Region of Southern Denmark
 More info
Office space in Vejen, Region of Southern Denmark
Office space for rent in Vejen, Region of Southern Denmark
Areal
Ca. 155 m2
Pris pr. md.
Not stated
Område
Vejen, Region of Southern Denmark
Type
Office space
Office space in Måløv, Greater Copenhagen
 More info
Office space in Måløv, Greater Copenhagen
Office space for rent in Måløv, Greater Copenhagen
Areal
-
Pris pr. md.
Ca. 2,650 DKK pr md
Område
Måløv, Greater Copenhagen
Type
Office space
Office space in Hamburg Mitte, Hamburg
 More info
Office space in Hamburg Mitte, Hamburg
Office space for rent in Hamburg Mitte, Hamburg
Areal
Ca. 295 m2
Pris pr. md.
Not stated
Område
Hamburg Mitte, Hamburg
Type
Office space
Office space in Helsinki Eteläinen, Helsinki
 More info
Office space in Helsinki Eteläinen, Helsinki
Office space for rent in Helsinki Eteläinen, Helsinki
Areal
Ca. 25 m2
Pris pr. md.
Not stated
Område
Helsinki Eteläinen, Helsinki
Type
Office space
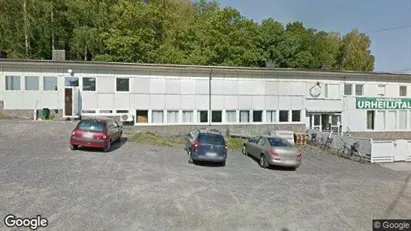
Office space in Turku, Varsinais-Suomi
 More info
Office space in Turku, Varsinais-Suomi
Office space for rent in Turku, Varsinais-Suomi
Areal
-
Pris pr. md.
Not stated
Område
Turku, Varsinais-Suomi
Type
Office space
Office space in Porvoo, Uusimaa
 More info
Office space in Porvoo, Uusimaa
Office space for rent in Porvoo, Uusimaa
Areal
Ca. 840 m2
Pris pr. md.
Not stated
Område
Porvoo, Uusimaa
Type
Office space
Office space in Rødovre, Greater Copenhagen
 More info
Office space in Rødovre, Greater Copenhagen
Office space for rent in Rødovre, Greater Copenhagen
Areal
Ca. 1,405 m2
Pris pr. md.
Ca. 145,000 DKK pr md
Område
Rødovre, Greater Copenhagen
Type
Office space
Office space in Måløv, Greater Copenhagen
 More info
Office space in Måløv, Greater Copenhagen
Office space for rent in Måløv, Greater Copenhagen
Areal
-
Pris pr. md.
Ca. 4,250 DKK pr md
Område
Måløv, Greater Copenhagen
Type
Office space
Office space in Måløv, Greater Copenhagen
 More info
Office space in Måløv, Greater Copenhagen
Office space for rent in Måløv, Greater Copenhagen
Areal
-
Pris pr. md.
Ca. 4,250 DKK pr md
Område
Måløv, Greater Copenhagen
Type
Office space
Office space in Stockholm City, Stockholm
 More info
Office space in Stockholm City, Stockholm
Office space for rent in Stockholm City, Stockholm
Areal
Ca. 150 m2
Pris pr. md.
Ca. 61,000 SEK pr md
Område
Stockholm City, Stockholm
Type
Office space
Office space in Herning, Central Jutland Region
 More info
Office space in Herning, Central Jutland Region
Office space for rent in Herning, Central Jutland Region
Areal
Ca. 225 m2
Pris pr. md.
Ca. 26,500 DKK pr md
Område
Herning, Central Jutland Region
Type
Office space
Office space in Måløv, Greater Copenhagen
 More info
Office space in Måløv, Greater Copenhagen
Office space for rent in Måløv, Greater Copenhagen
Areal
-
Pris pr. md.
Ca. 16,000 DKK pr md
Område
Måløv, Greater Copenhagen
Type
Office space
Office space in Tychy, Śląskie
 More info
Office space in Tychy, Śląskie
Office space for rent in Tychy, Śląskie
Areal
Ca. 420 m2
Pris pr. md.
Ca. 9,250 PLN pr md
Område
Tychy, Śląskie
Type
Office space
Selected customers
30,000 customers use Companyspace.com
30,000 customers
285,000 companies in our database
2,400 rentals annually
Companyspace.com is used by thousands of landlords, property companies, commercial real estate agents, investors and business centres seeking greater visibility, more enquiries and lower vacancy rates.


