


Office space for rent in Europe
There are 129,448 available office spaces in Europe right now. Companyspace.com collects office spaces from many different parts of the market, so that you as a company can more easily get an overview of available office spaces in Europe.
Companyspace.com today:
New today 2,860
Updated 24h 4,226
Notifications about new companyspaces64
Berlin +3
Paris +5
Madrid +1
Dublin (county) +23
Warsaw +19
Greater London +12
Latest update 36 min ago
Active ads 368,929
129,448 office spaces found
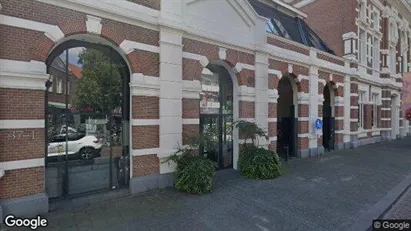
Office space in Breda, North Brabant
 More info
Office space in Breda, North Brabant
Office space for rent in Breda, North Brabant
Areal
Ca. 220 m2
Pris pr. md.
Ca. 3,850 EUR pr md
Område
Breda, North Brabant
Type
Office space
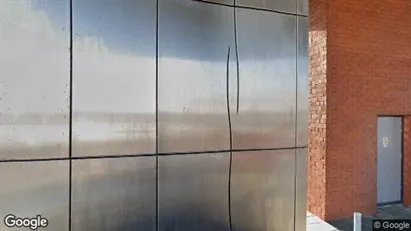
Office space in Duiven, Gelderland
 More info
Office space in Duiven, Gelderland
Office space for rent in Duiven, Gelderland
Areal
Ca. 245 m2
Pris pr. md.
Ca. 1,950 EUR pr md
Område
Duiven, Gelderland
Type
Office space
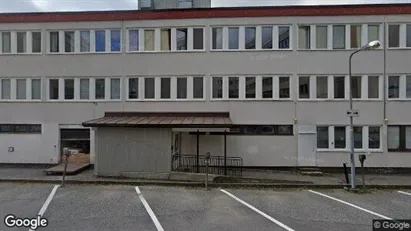
Office space in Stockholm West, Stockholm
 More info
Office space in Stockholm West, Stockholm
Office space for rent in Stockholm West, Stockholm
Areal
Ca. 185 m2
Pris pr. md.
Ca. 21,000 SEK pr md
Område
Stockholm West, Stockholm
Type
Office space
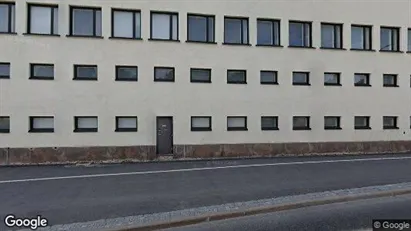
Office space in Turku, Varsinais-Suomi
 More info
Office space in Turku, Varsinais-Suomi
Office space for rent in Turku, Varsinais-Suomi
Areal
-
Pris pr. md.
Not stated
Område
Turku, Varsinais-Suomi
Type
Office space
Office space in Viby J, Aarhus
 More info
Office space in Viby J, Aarhus
Office space for rent in Viby J, Aarhus
Areal
Ca. 310 m2
Pris pr. md.
Ca. 19,400 DKK pr md
Område
Viby J, Aarhus
Type
Office space
Office space in Heiloo, North Holland
 More info
Office space in Heiloo, North Holland
Office space for rent in Heiloo, North Holland
Areal
Ca. 475 m2
Pris pr. md.
Ca. 2,950 EUR pr md
Område
Heiloo, North Holland
Type
Office space
Office space in Nordhavn, Copenhagen
 More info
Office space in Nordhavn, Copenhagen
Office space for rent in Nordhavn, Copenhagen
Areal
Ca. 2,070 m2
Pris pr. md.
Not stated
Område
Nordhavn, Copenhagen
Type
Office space
Office space in Østerbro, Copenhagen
 More info
Office space in Østerbro, Copenhagen
Office space for rent in Østerbro, Copenhagen
Areal
Ca. 4,895 m2
Pris pr. md.
Ca. 995,500 DKK pr md
Område
Østerbro, Copenhagen
Type
Office space
Office space in Aarhus C, Aarhus
 More info
Office space in Aarhus C, Aarhus
Office space for rent in Aarhus C, Aarhus
Areal
Ca. 135 m2
Pris pr. md.
Ca. 11,050 DKK pr md
Område
Aarhus C, Aarhus
Type
Office space
Office space in Østerbro, Copenhagen
 More info
Office space in Østerbro, Copenhagen
Office space for rent in Østerbro, Copenhagen
Areal
Ca. 650 m2
Pris pr. md.
Not stated
Område
Østerbro, Copenhagen
Type
Office space
Office space in Aarhus N, Aarhus
 More info
Office space in Aarhus N, Aarhus
Office space for rent in Aarhus N, Aarhus
Areal
Ca. 305 m2
Pris pr. md.
Ca. 28,050 DKK pr md
Område
Aarhus N, Aarhus
Type
Office space
Office space in Heiloo, North Holland
 More info
Office space in Heiloo, North Holland
Office space for rent in Heiloo, North Holland
Areal
Ca. 475 m2
Pris pr. md.
Ca. 2,950 EUR pr md
Område
Heiloo, North Holland
Type
Office space
Office space in Kolding, Region of Southern Denmark
 More info
Office space in Kolding, Region of Southern Denmark
Office space for rent in Kolding, Region of Southern Denmark
Areal
Ca. 225 m2
Pris pr. md.
Ca. 9,250 DKK pr md
Område
Kolding, Region of Southern Denmark
Type
Office space
Office space in Østerbro, Copenhagen
 More info
Office space in Østerbro, Copenhagen
Office space for rent in Østerbro, Copenhagen
Areal
Ca. 730 m2
Pris pr. md.
Not stated
Område
Østerbro, Copenhagen
Type
Office space
Office space in Viby J, Aarhus
 More info
Office space in Viby J, Aarhus
Office space for rent in Viby J, Aarhus
Areal
Ca. 290 m2
Pris pr. md.
Ca. 18,150 DKK pr md
Område
Viby J, Aarhus
Type
Office space
Office space in Aarhus C, Aarhus
 More info
Office space in Aarhus C, Aarhus
Office space for rent in Aarhus C, Aarhus
Areal
Ca. 175 m2
Pris pr. md.
Ca. 15,500 DKK pr md
Område
Aarhus C, Aarhus
Type
Office space
Office space in Dublin 7, Dublin
 More info
Office space in Dublin 7, Dublin
Office space for rent in Dublin 7, Dublin
Areal
Ca. 15 m2
Pris pr. md.
Ca. 1,000 EUR pr md
Område
Dublin 7, Dublin
Type
Office space
Office space in Antwerp Merksem, Antwerp
 More info
Office space in Antwerp Merksem, Antwerp
Office space for rent in Antwerp Merksem, Antwerp
Areal
Ca. 180 m2
Pris pr. md.
Ca. 1,600 EUR pr md
Område
Antwerp Merksem, Antwerp
Type
Office space
Selected customers
30,000 customers use Companyspace.com
30,000 customers
285,000 companies in our database
2,400 rentals annually
Companyspace.com is used by thousands of landlords, property companies, commercial real estate agents, investors and business centres seeking greater visibility, more enquiries and lower vacancy rates.


