


Office space for rent in Europe
There are 129,437 available office spaces in Europe right now. Companyspace.com collects office spaces from many different parts of the market, so that you as a company can more easily get an overview of available office spaces in Europe.
Companyspace.com today:
New today 2,889
Updated 24h 3,963
Notifications about new companyspaces1,639
Amsterdam +3
Berlin +3
Vienna +6
Paris +5
Madrid +4
Dublin (county) +23
Warsaw +19
Greater London +12
Latest update 19 min ago
Active ads 368,911
129,437 office spaces found
Office space in Marousi, Attica
 More info
Office space in Marousi, Attica
Office space for rent in Marousi, Attica
Areal
Ca. 20 m2
Pris pr. md.
Ca. 200 EUR pr md
Område
Marousi, Attica
Type
Office space
Office space in Vojens, Region of Southern Denmark
 More info
Office space in Vojens, Region of Southern Denmark
Office space for rent in Vojens, Region of Southern Denmark
Areal
Ca. 215 m2
Pris pr. md.
Ca. 11,300 DKK pr md
Område
Vojens, Region of Southern Denmark
Type
Office space
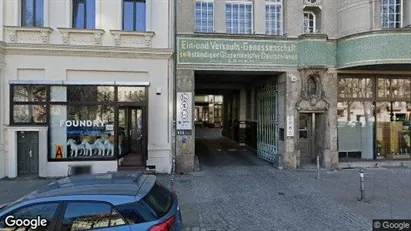
Office space in Dortmund, Nordrhein-Westfalen
 More info
Office space in Dortmund, Nordrhein-Westfalen
Office space for rent in Dortmund, Nordrhein-Westfalen
Areal
Ca. 55 m2
Pris pr. md.
Not stated
Område
Dortmund, Nordrhein-Westfalen
Type
Office space
Office space in Hamburg Mitte, Hamburg
 More info
Office space in Hamburg Mitte, Hamburg
Office space for rent in Hamburg Mitte, Hamburg
Areal
Ca. 240 m2
Pris pr. md.
Not stated
Område
Hamburg Mitte, Hamburg
Type
Office space
Office space in Horsens, Central Jutland Region
More info
Office space in Horsens, Central Jutland Region
Office space for rent in Horsens, Central Jutland Region
Areal
Ca. 300 m2
Pris pr. md.
Ca. 21,200 DKK pr md
Område
Horsens, Central Jutland Region
Type
Office space
Office space in Horsens, Central Jutland Region
 More info
Office space in Horsens, Central Jutland Region
Office space for rent in Horsens, Central Jutland Region
Areal
Ca. 465 m2
Pris pr. md.
Ca. 15,050 DKK pr md
Område
Horsens, Central Jutland Region
Type
Office space
Office space in Östermalm, Stockholm
More info
Office space in Östermalm, Stockholm
Office space for rent in Östermalm, Stockholm
Areal
Ca. 85 m2
Pris pr. md.
Ca. 30,750 SEK pr md
Område
Östermalm, Stockholm
Type
Office space
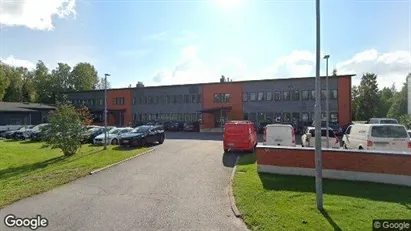
Office space in Oulu, Pohjois-Pohjanmaa
 More info
Office space in Oulu, Pohjois-Pohjanmaa
Office space for rent in Oulu, Pohjois-Pohjanmaa
Areal
Ca. 150 m2
Pris pr. md.
Not stated
Område
Oulu, Pohjois-Pohjanmaa
Type
Office space
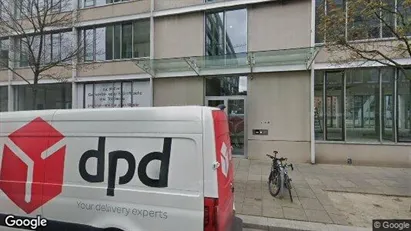
Office space in Berlin Friedrichshain-Kreuzberg, Berlin
 More info
Office space in Berlin Friedrichshain-Kreuzberg, Berlin
Office space for rent in Berlin Friedrichshain-Kreuzberg, Berlin
Areal
Ca. 210 m2
Pris pr. md.
Not stated
Område
Berlin Friedrichshain-Kreuzberg, Berlin
Type
Office space
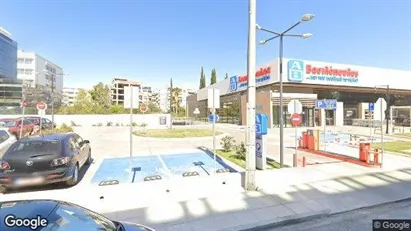
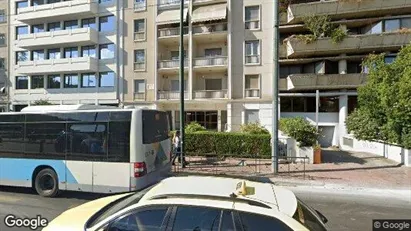
Office space in Athens Kolonaki, Athens
 More info
Office space in Athens Kolonaki, Athens
Office space for rent in Athens Kolonaki, Athens
Areal
Ca. 45 m2
Pris pr. md.
Ca. 1,800 EUR pr md
Område
Athens Kolonaki, Athens
Type
Office space
Office space in Sundbyberg, Stockholm County
 More info
Office space in Sundbyberg, Stockholm County
Office space for rent in Sundbyberg, Stockholm County
Areal
Ca. 50 m2
Pris pr. md.
Ca. 6,250 SEK pr md
Område
Sundbyberg, Stockholm County
Type
Office space
Office space in Silkeborg, Central Jutland Region
More info
Office space in Silkeborg, Central Jutland Region
Office space for rent in Silkeborg, Central Jutland Region
Areal
Ca. 120 m2
Pris pr. md.
Ca. 7,250 DKK pr md
Område
Silkeborg, Central Jutland Region
Type
Office space
Warehouse in Vejle, Vejle (region)
More info
Warehouse in Vejle, Vejle (region)
Warehouse for rent in Vejle, Vejle (region)
Areal
Ca. 205 m2
Pris pr. md.
Ca. 10,900 DKK pr md
Område
Vejle, Vejle (region)
Type
Warehouse
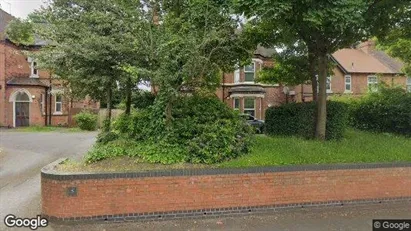
Office space in Birmingham - West Midlands, West Midlands
 More info
Office space in Birmingham - West Midlands, West Midlands
Office space for rent in Birmingham - West Midlands, West Midlands
Areal
Ca. 1,040 m2
Pris pr. md.
Not stated
Område
Birmingham - West Midlands, West Midlands
Type
Office space
Office space in Haninge, Stockholm County
More info
Office space in Haninge, Stockholm County
Office space for rent in Haninge, Stockholm County
Areal
Ca. 120 m2
Pris pr. md.
Ca. 9,850 SEK pr md
Område
Haninge, Stockholm County
Type
Office space
Coworking space in Esbjerg, Esbjerg (region)
More info
Coworking space in Esbjerg, Esbjerg (region)
Coworking space for rent in Esbjerg, Esbjerg (region)
Areal
Ca. 100 m2
Pris pr. md.
Ca. 1,400 DKK pr md
Område
Esbjerg, Esbjerg (region)
Type
Coworking space
Coworking space in Haderslev, Region of Southern Denmark
More info
Coworking space in Haderslev, Region of Southern Denmark
Coworking space for rent in Haderslev, Region of Southern Denmark
Areal
Ca. 40 m2
Pris pr. md.
Ca. 1,500 DKK pr md
Område
Haderslev, Region of Southern Denmark
Type
Coworking space
Coworking space in Horsens, Central Jutland Region
More info
Coworking space in Horsens, Central Jutland Region
Coworking space for rent in Horsens, Central Jutland Region
Areal
Ca. 100 m2
Pris pr. md.
Ca. 2,500 DKK pr md
Område
Horsens, Central Jutland Region
Type
Coworking space
Selected customers
30,000 customers use Companyspace.com
30,000 customers
285,000 companies in our database
2,400 rentals annually
Companyspace.com is used by thousands of landlords, property companies, commercial real estate agents, investors and business centres seeking greater visibility, more enquiries and lower vacancy rates.


