


Office space for rent in Europe
There are 129,437 available office spaces in Europe right now. Companyspace.com collects office spaces from many different parts of the market, so that you as a company can more easily get an overview of available office spaces in Europe.
Companyspace.com today:
New today 2,893
Updated 24h 3,922
Notifications about new companyspaces1,736
Amsterdam +3
Berlin +3
Vienna +6
Paris +5
Madrid +4
Dublin (county) +23
Warsaw +19
Greater London +13
Latest update 14 min ago
Active ads 368,913
129,437 office spaces found
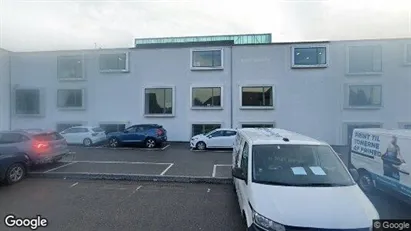
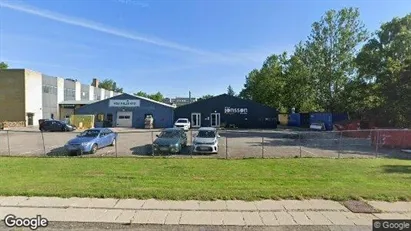
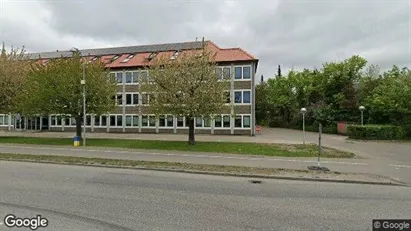
Office space in Brøndby, Greater Copenhagen
 More info
Office space in Brøndby, Greater Copenhagen
Office space for rent in Brøndby, Greater Copenhagen
Areal
Ca. 740 m2
Pris pr. md.
Ca. 55,350 DKK pr md
Område
Brøndby, Greater Copenhagen
Type
Office space
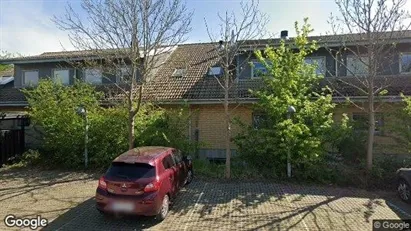
Office space in Skovlunde, Greater Copenhagen
 More info
Office space in Skovlunde, Greater Copenhagen
Office space for rent in Skovlunde, Greater Copenhagen
Areal
Ca. 975 m2
Pris pr. md.
Ca. 75,300 DKK pr md
Område
Skovlunde, Greater Copenhagen
Type
Office space
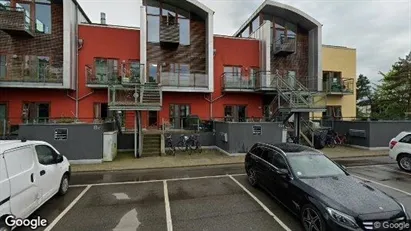
Office space in Glostrup, Greater Copenhagen
 More info
Office space in Glostrup, Greater Copenhagen
Office space for rent in Glostrup, Greater Copenhagen
Areal
Ca. 495 m2
Pris pr. md.
Ca. 28,800 DKK pr md
Område
Glostrup, Greater Copenhagen
Type
Office space
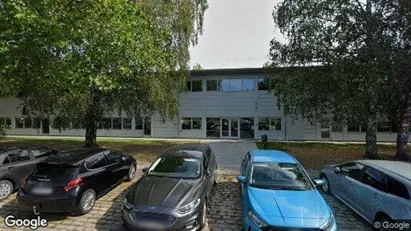
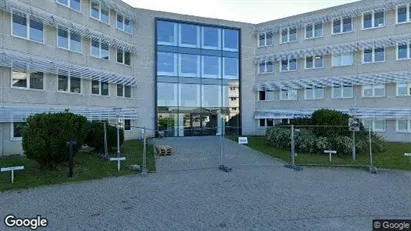
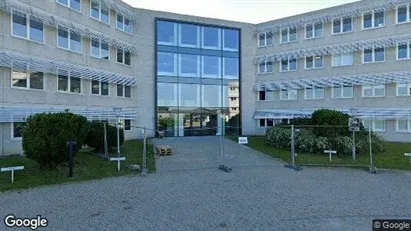
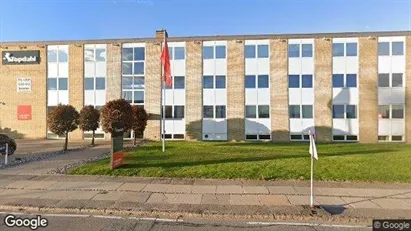
Office space in Birkerød, North Zealand
 More info
Office space in Birkerød, North Zealand
Office space for rent in Birkerød, North Zealand
Areal
Ca. 1,235 m2
Pris pr. md.
Ca. 82,250 DKK pr md
Område
Birkerød, North Zealand
Type
Office space
Office space in Søborg, Greater Copenhagen
 More info
Office space in Søborg, Greater Copenhagen
Office space for rent in Søborg, Greater Copenhagen
Areal
Ca. 95 m2
Pris pr. md.
Ca. 8,200 DKK pr md
Område
Søborg, Greater Copenhagen
Type
Office space
Office space in Herlev, Greater Copenhagen
 More info
Office space in Herlev, Greater Copenhagen
Office space for rent in Herlev, Greater Copenhagen
Areal
Ca. 800 m2
Pris pr. md.
Ca. 45,000 DKK pr md
Område
Herlev, Greater Copenhagen
Type
Office space
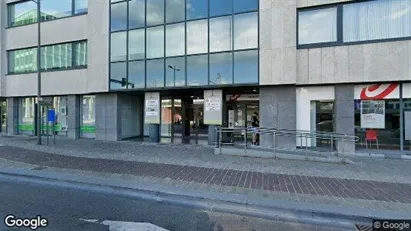
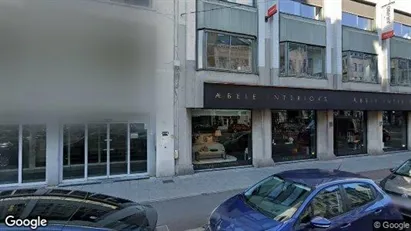
Office space in Stad Antwerp, Antwerp
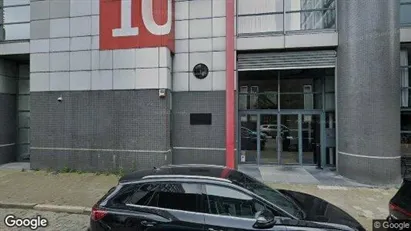 More info
Office space in Stad Antwerp, Antwerp
Office space for rent in Stad Antwerp, Antwerp
Areal
Ca. 50 m2
Pris pr. md.
Ca. 1,750 EUR pr md
Område
Stad Antwerp, Antwerp
Type
Office space
Office space in Skovlunde, Greater Copenhagen
 More info
Office space in Skovlunde, Greater Copenhagen
Office space for rent in Skovlunde, Greater Copenhagen
Areal
Ca. 115 m2
Pris pr. md.
Ca. 59,050 DKK pr md
Område
Skovlunde, Greater Copenhagen
Type
Office space
Office space in Birkerød, North Zealand
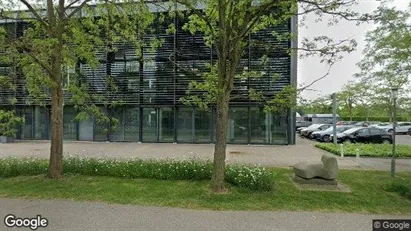 More info
Office space in Birkerød, North Zealand
Office space for rent in Birkerød, North Zealand
Areal
Ca. 820 m2
Pris pr. md.
Ca. 58,100 DKK pr md
Område
Birkerød, North Zealand
Type
Office space
Office space in Antwerp Berchem, Antwerp
 More info
Office space in Antwerp Berchem, Antwerp
Office space for rent in Antwerp Berchem, Antwerp
Areal
Ca. 210 m2
Pris pr. md.
Ca. 2,600 EUR pr md
Område
Antwerp Berchem, Antwerp
Type
Office space
Office space in Skovlunde, Greater Copenhagen
 More info
Office space in Skovlunde, Greater Copenhagen
Office space for rent in Skovlunde, Greater Copenhagen
Areal
Ca. 325 m2
Pris pr. md.
Ca. 23,850 DKK pr md
Område
Skovlunde, Greater Copenhagen
Type
Office space
Office space in Barcelona Eixample, Barcelona
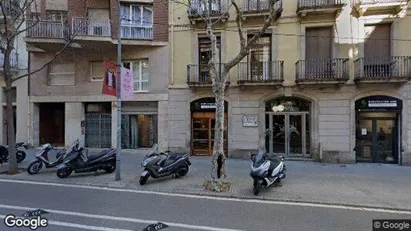 More info
Office space in Barcelona Eixample, Barcelona
Office space for rent in Barcelona Eixample, Barcelona
Areal
Ca. 5 m2
Pris pr. md.
Ca. 50 EUR pr md
Område
Barcelona Eixample, Barcelona
Type
Office space
Office space in Gouda, South Holland
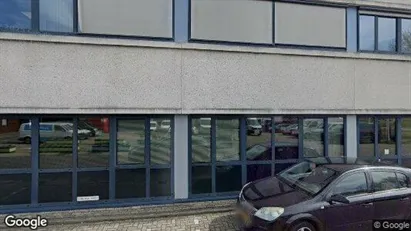 More info
Office space in Gouda, South Holland
Office space for rent in Gouda, South Holland
Areal
Ca. 80 m2
Pris pr. md.
Ca. 600 EUR pr md
Område
Gouda, South Holland
Type
Office space
Office space in Brøndby, Greater Copenhagen
 More info
Office space in Brøndby, Greater Copenhagen
Office space for rent in Brøndby, Greater Copenhagen
Areal
Ca. 835 m2
Pris pr. md.
Ca. 66,200 DKK pr md
Område
Brøndby, Greater Copenhagen
Type
Office space
Office space in Herlev, Greater Copenhagen
 More info
Office space in Herlev, Greater Copenhagen
Office space for rent in Herlev, Greater Copenhagen
Areal
Ca. 635 m2
Pris pr. md.
Ca. 39,550 DKK pr md
Område
Herlev, Greater Copenhagen
Type
Office space
Office space in Stad Antwerp, Antwerp
 More info
Office space in Stad Antwerp, Antwerp
Office space for rent in Stad Antwerp, Antwerp
Areal
Ca. 350 m2
Pris pr. md.
Ca. 3,500 EUR pr md
Område
Stad Antwerp, Antwerp
Type
Office space
Office space in Brøndby, Greater Copenhagen
 More info
Office space in Brøndby, Greater Copenhagen
Office space for rent in Brøndby, Greater Copenhagen
Areal
Ca. 535 m2
Pris pr. md.
Ca. 42,450 DKK pr md
Område
Brøndby, Greater Copenhagen
Type
Office space
Office space in Birkerød, North Zealand
 More info
Office space in Birkerød, North Zealand
Office space for rent in Birkerød, North Zealand
Areal
Ca. 615 m2
Pris pr. md.
Ca. 41,150 DKK pr md
Område
Birkerød, North Zealand
Type
Office space
Selected customers
30,000 customers use Companyspace.com
30,000 customers
285,000 companies in our database
2,400 rentals annually
Companyspace.com is used by thousands of landlords, property companies, commercial real estate agents, investors and business centres seeking greater visibility, more enquiries and lower vacancy rates.


