


Office space for rent in Europe
There are 129,390 available office spaces in Europe right now. Companyspace.com collects office spaces from many different parts of the market, so that you as a company can more easily get an overview of available office spaces in Europe.
Companyspace.com today:
New today 2,251
Updated 24h 4,008
Berlin +3
Dublin (county) +3
Warsaw +15
Latest update 4 min ago
Active ads 368,565
129,390 office spaces found
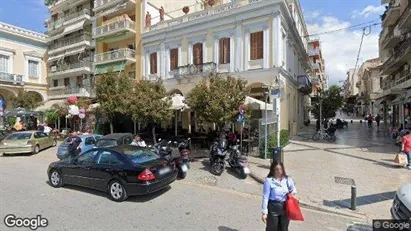
Office space in Patras, Western Greece
 More info
Office space in Patras, Western Greece
Office space for rent in Patras, Western Greece
Areal
Ca. 75 m2
Pris pr. md.
Ca. 450 EUR pr md
Område
Patras, Western Greece
Type
Office space
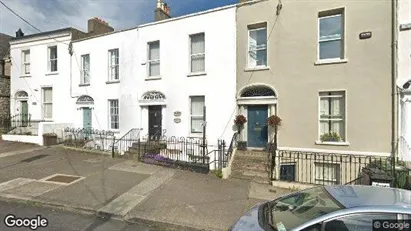
Office space in Dun Laoghaire, Dublin (county)
 More info
Office space in Dun Laoghaire, Dublin (county)
Office space for rent in Dun Laoghaire, Dublin (county)
Areal
Ca. 50 m2
Pris pr. md.
Ca. 1,250 EUR pr md
Område
Dun Laoghaire, Dublin (county)
Type
Office space
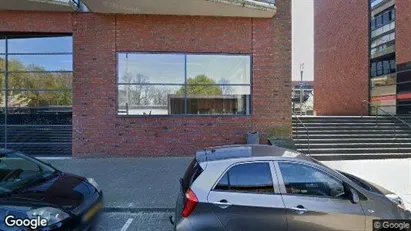
Office space in Rotterdam Hoogvliet, Rotterdam
 More info
Office space in Rotterdam Hoogvliet, Rotterdam
Kantoor te huur in Rotterdam Hoogvliet, Rotterdam
Areal
Ca. 390 m2
Pris pr. md.
Not stated
Område
Rotterdam Hoogvliet, Rotterdam
Type
Office space
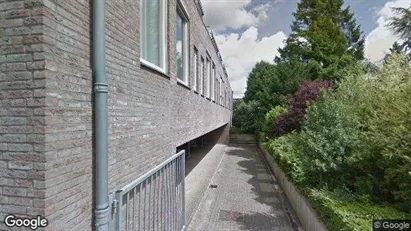
Office space in Kollumerland en Nieuwkruisland, Friesland NL
 More info
Office space in Kollumerland en Nieuwkruisland, Friesland NL
Office space for rent in Kollumerland en Nieuwkruisland, Friesland NL
Areal
Ca. 450 m2
Pris pr. md.
Ca. 50 EUR pr md
Område
Kollumerland en Nieuwkruisland, Friesland NL
Type
Office space
Office space in Glyfada, Attica
 More info
Office space in Glyfada, Attica
Office space for rent in Glyfada, Attica
Areal
Ca. 140 m2
Pris pr. md.
Ca. 3,000 EUR pr md
Område
Glyfada, Attica
Type
Office space
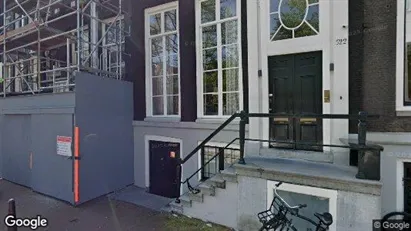
Office space in Amsterdam Centrum, Amsterdam
 More info
Office space in Amsterdam Centrum, Amsterdam
Office space for rent in Amsterdam Centrum, Amsterdam
Areal
Ca. 125 m2
Pris pr. md.
Ca. 4,350 EUR pr md
Område
Amsterdam Centrum, Amsterdam
Type
Office space
Office space in Dublin 2, Dublin
 More info
Office space in Dublin 2, Dublin
Office space for rent in Dublin 2, Dublin
Areal
Ca. 15 m2
Pris pr. md.
Ca. 1,250 EUR pr md
Område
Dublin 2, Dublin
Type
Office space
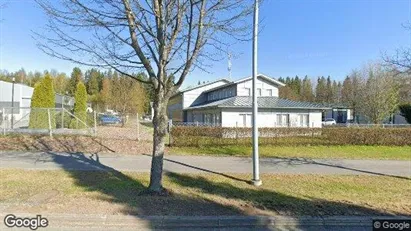
Office space in Tampere Lounainen, Tampere
 More info
Office space in Tampere Lounainen, Tampere
Office space for rent in Tampere Lounainen, Tampere
Areal
Ca. 15 m2
Pris pr. md.
Ca. 300 EUR pr md
Område
Tampere Lounainen, Tampere
Type
Office space
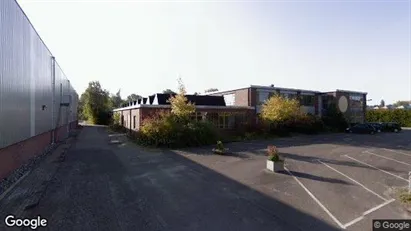
Office space in Groningen, Groningen (region)
 More info
Office space in Groningen, Groningen (region)
Office space for rent in Groningen, Groningen (region)
Areal
Ca. 35 m2
Pris pr. md.
Ca. 8,350 EUR pr md
Område
Groningen, Groningen (region)
Type
Office space
Office space in Dublin 2, Dublin
 More info
Office space in Dublin 2, Dublin
Office space for rent in Dublin 2, Dublin
Areal
Ca. 15 m2
Pris pr. md.
Ca. 1,250 EUR pr md
Område
Dublin 2, Dublin
Type
Office space
Warehouse in Vejle Øst, Vejle (region)
 More info
Warehouse in Vejle Øst, Vejle (region)
Warehouse for rent in Vejle Øst, Vejle (region)
Areal
Ca. 510 m2
Pris pr. md.
Ca. 17,500 DKK pr md
Område
Vejle Øst, Vejle (region)
Type
Warehouse
Office space in Dublin 4, Dublin
 More info
Office space in Dublin 4, Dublin
Office space for rent in Dublin 4, Dublin
Areal
Ca. 40 m2
Pris pr. md.
Ca. 2,500 EUR pr md
Område
Dublin 4, Dublin
Type
Office space
Office space in Rotterdam Delfshaven, Rotterdam
 More info
Office space in Rotterdam Delfshaven, Rotterdam
Kantoor te huur in Rotterdam Delfshaven, Rotterdam
Areal
Ca. 260 m2
Pris pr. md.
Not stated
Område
Rotterdam Delfshaven, Rotterdam
Type
Office space
Office space in Renkum, Gelderland
 More info
Office space in Renkum, Gelderland
Office space for rent in Renkum, Gelderland
Areal
Ca. 90 m2
Pris pr. md.
Ca. 850 EUR pr md
Område
Renkum, Gelderland
Type
Office space
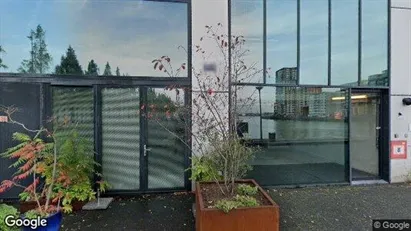
Office space in Tallinn Haabersti, Tallinn
 More info
Office space in Tallinn Haabersti, Tallinn
Office space for rent in Tallinn Haabersti, Tallinn
Areal
Ca. 80 m2
Pris pr. md.
Ca. 1,000 EUR pr md
Område
Tallinn Haabersti, Tallinn
Type
Office space
Office space in Tallinn Kesklinna, Tallinn
 More info
Office space in Tallinn Kesklinna, Tallinn
Office space for rent in Tallinn Kesklinna, Tallinn
Areal
Ca. 90 m2
Pris pr. md.
Ca. 1,650 EUR pr md
Område
Tallinn Kesklinna, Tallinn
Type
Office space
Office space in Houten, Province of Utrecht
 More info
Office space in Houten, Province of Utrecht
Office space for rent in Houten, Province of Utrecht
Areal
-
Pris pr. md.
Ca. 2,150 EUR pr md
Område
Houten, Province of Utrecht
Type
Office space
Office space in Amsterdam Centrum, Amsterdam
 More info
Office space in Amsterdam Centrum, Amsterdam
Office space for rent in Amsterdam Centrum, Amsterdam
Areal
Ca. 45 m2
Pris pr. md.
Ca. 1,000 EUR pr md
Område
Amsterdam Centrum, Amsterdam
Type
Office space
Selected customers
30,000 customers use Companyspace.com
30,000 customers
285,000 companies in our database
2,400 rentals annually
Companyspace.com is used by thousands of landlords, property companies, commercial real estate agents, investors and business centres seeking greater visibility, more enquiries and lower vacancy rates.


