


Office space for rent in Europe
There are 129,446 available office spaces in Europe right now. Companyspace.com collects office spaces from many different parts of the market, so that you as a company can more easily get an overview of available office spaces in Europe.
Companyspace.com today:
New today 2,864
Updated 24h 4,226
Notifications about new companyspaces64
Berlin +3
Paris +5
Madrid +4
Dublin (county) +23
Warsaw +19
Greater London +12
Latest update 1 min ago
Active ads 368,922
129,446 office spaces found
Office space in IJsselstein, Province of Utrecht
 More info
Office space in IJsselstein, Province of Utrecht
Office space for rent in IJsselstein, Province of Utrecht
Areal
-
Pris pr. md.
Not stated
Område
IJsselstein, Province of Utrecht
Type
Office space
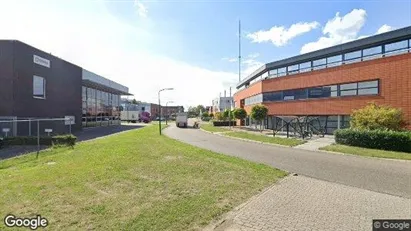
Office space in Esbjerg Ø, Esbjerg (region)
 More info
Office space in Esbjerg Ø, Esbjerg (region)
Office space for rent in Esbjerg Ø, Esbjerg (region)
Areal
Ca. 6,575 m2
Pris pr. md.
Ca. 273,950 DKK pr md
Område
Esbjerg Ø, Esbjerg (region)
Type
Office space
Office space in Amsterdam Centrum, Amsterdam
 More info
Office space in Amsterdam Centrum, Amsterdam
Office space for rent in Amsterdam Centrum, Amsterdam
Areal
Ca. 190 m2
Pris pr. md.
Ca. 19,700 EUR pr md
Område
Amsterdam Centrum, Amsterdam
Type
Office space
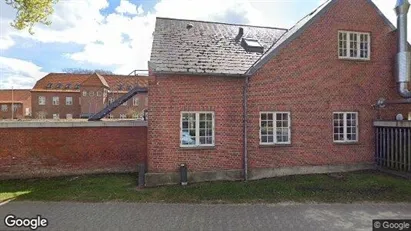
Office space in Aalborg, Aalborg (region)
 More info
Office space in Aalborg, Aalborg (region)
Office space for rent in Aalborg, Aalborg (region)
Areal
Ca. 20 m2
Pris pr. md.
Ca. 8,500 DKK pr md
Område
Aalborg, Aalborg (region)
Type
Office space
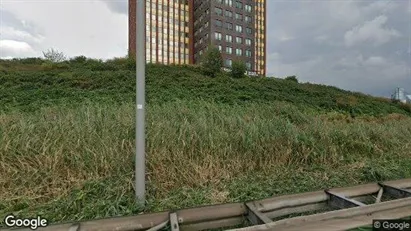
Office space in Rotterdam Prins Alexander, Rotterdam
 More info
Office space in Rotterdam Prins Alexander, Rotterdam
Kantoor te huur in Rotterdam Prins Alexander, Rotterdam
Areal
Ca. 1,805 m2
Pris pr. md.
Not stated
Område
Rotterdam Prins Alexander, Rotterdam
Type
Office space
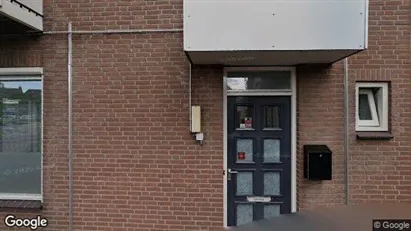
Office space in Oude IJsselstreek, Gelderland
 More info
Office space in Oude IJsselstreek, Gelderland
Office space for rent in Oude IJsselstreek, Gelderland
Areal
Ca. 105 m2
Pris pr. md.
Ca. 1,150 EUR pr md
Område
Oude IJsselstreek, Gelderland
Type
Office space
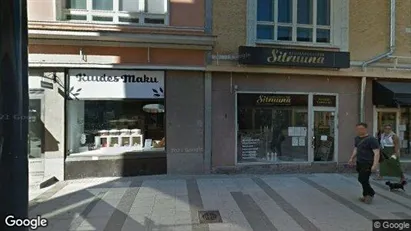
Office space in Turku, Varsinais-Suomi
 More info
Office space in Turku, Varsinais-Suomi
Office space for rent in Turku, Varsinais-Suomi
Areal
-
Pris pr. md.
Not stated
Område
Turku, Varsinais-Suomi
Type
Office space
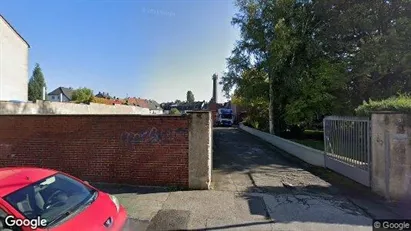
Office space in Mönchengladbach, Nordrhein-Westfalen
 More info
Office space in Mönchengladbach, Nordrhein-Westfalen
Office space for rent in Mönchengladbach, Nordrhein-Westfalen
Areal
Ca. 515 m2
Pris pr. md.
Not stated
Område
Mönchengladbach, Nordrhein-Westfalen
Type
Office space
Office space in Dilbeek, Vlaams-Brabant
 More info
Office space in Dilbeek, Vlaams-Brabant
Office space for rent in Dilbeek, Vlaams-Brabant
Areal
Ca. 55 m2
Pris pr. md.
Ca. 650 EUR pr md
Område
Dilbeek, Vlaams-Brabant
Type
Office space
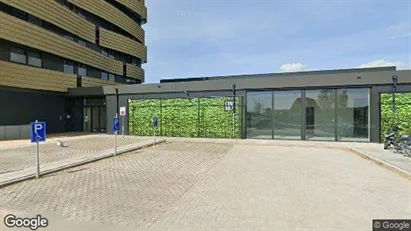
Office space in Sittard-Geleen, Limburg
 More info
Office space in Sittard-Geleen, Limburg
TE HUUR | KANTOORRUIMTES VANAF 20 m²
Ben je op zoek naar representatieve kantoorruimte in Sittard? Er zijn diverse kantoorunits beschikbaar, ideaal voor o...
Areal
20 - 100 m2
Pris pr. md.
Ca. 8,350 EUR pr md
Område
Sittard-Geleen, Limburg
Type
Office space
Office space in Heerenveen, Friesland NL
 More info
Office space in Heerenveen, Friesland NL
Office space for rent in Heerenveen, Friesland NL
Areal
Ca. 20 m2
Pris pr. md.
Ca. 700 EUR pr md
Område
Heerenveen, Friesland NL
Type
Office space
Office space in Oulu, Pohjois-Pohjanmaa
 More info
Office space in Oulu, Pohjois-Pohjanmaa
Office space for rent in Oulu, Pohjois-Pohjanmaa
Areal
Ca. 150 m2
Pris pr. md.
Not stated
Område
Oulu, Pohjois-Pohjanmaa
Type
Office space
Office space in Dublin 2, Dublin
 More info
Office space in Dublin 2, Dublin
Office space for rent in Dublin 2, Dublin
Areal
Ca. 5 m2
Pris pr. md.
Ca. 127,400 EUR pr md
Område
Dublin 2, Dublin
Type
Office space
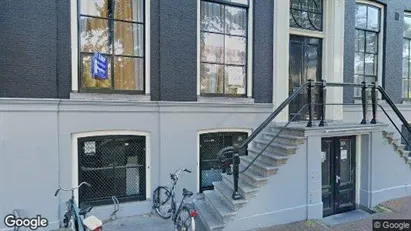
Office space in Amsterdam Centrum, Amsterdam
 More info
Office space in Amsterdam Centrum, Amsterdam
Office space for rent in Amsterdam Centrum, Amsterdam
Areal
Ca. 140 m2
Pris pr. md.
Ca. 15,750 EUR pr md
Område
Amsterdam Centrum, Amsterdam
Type
Office space
Office space in Leeuwarden, Friesland NL
 More info
Office space in Leeuwarden, Friesland NL
Office space for rent in Leeuwarden, Friesland NL
Areal
1,880 - 5,323 m2
Pris pr. md.
Ca. 21,750 EUR pr md
Område
Leeuwarden, Friesland NL
Type
Office space
Office space in Aalborg, Aalborg (region)
 More info
Office space in Aalborg, Aalborg (region)
Office space for rent in Aalborg, Aalborg (region)
Areal
Ca. 80 m2
Pris pr. md.
Ca. 5,300 DKK pr md
Område
Aalborg, Aalborg (region)
Type
Office space
Office space in Stad Antwerp, Antwerp
 More info
Office space in Stad Antwerp, Antwerp
Office space for rent in Stad Antwerp, Antwerp
Areal
Ca. 925 m2
Pris pr. md.
Ca. 12,500 EUR pr md
Område
Stad Antwerp, Antwerp
Type
Office space
Office space in Deventer, Overijssel
 More info
Office space in Deventer, Overijssel
Office space for rent in Deventer, Overijssel
Areal
Ca. 25 m2
Pris pr. md.
Ca. 100 EUR pr md
Område
Deventer, Overijssel
Type
Office space
Selected customers
30,000 customers use Companyspace.com
30,000 customers
285,000 companies in our database
2,400 rentals annually
Companyspace.com is used by thousands of landlords, property companies, commercial real estate agents, investors and business centres seeking greater visibility, more enquiries and lower vacancy rates.


