


Office space for rent in Europe
There are 129,446 available office spaces in Europe right now. Companyspace.com collects office spaces from many different parts of the market, so that you as a company can more easily get an overview of available office spaces in Europe.
Companyspace.com today:
New today 2,864
Updated 24h 4,226
Notifications about new companyspaces64
Berlin +3
Paris +5
Madrid +4
Dublin (county) +23
Warsaw +19
Greater London +12
Latest update 2 min ago
Active ads 368,922
129,446 office spaces found
Office space in Augsburg, Bayern
More info
We monitor the market!
Office space in Augsburg, Bayern
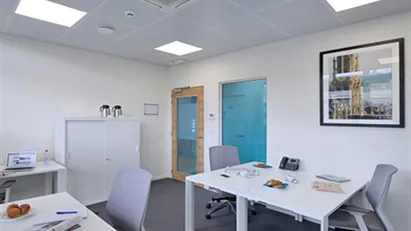
Konzentrieren Sie sich mit einem professionellen Büro nur für Sie auf den Erfolg Ihres Unternehmens.
Dieses Angebot umfasst einen privaten Serviced-Office-B...
Areal
Ca. 10 m2
Pris pr. md.
Ca. 650 EUR pr md
Område
Augsburg, Bayern
Type
Office space
Office space in Limhamn/Bunkeflo, Malmö
 More info
Office space in Limhamn/Bunkeflo, Malmö
Kontorslokaler i ny byggt fastighet
Areal
Ca. 400 m2
Pris pr. md.
Ca. 3,500 EUR pr md
Område
Limhamn/Bunkeflo, Malmö
Type
Office space
Clinic in Wrocław, Dolnośląskie
 More info
Clinic in Wrocław, Dolnośląskie
Attraktive Gewerbefläche in strategischer Lage von Breslau!
Wir bieten eine flexible Gewerbefläche von bis zu 600 m², die in bis zu 6 unabhängige Einheite...
Areal
Ca. 600 m2
Pris pr. md.
Ca. 10,000 EUR pr md
Område
Wrocław, Dolnośląskie
Type
Clinic
Office space in Lundby, Gothenburg
 More info
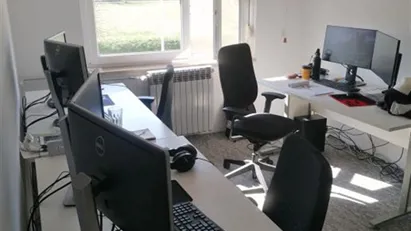
Office space in Lundby, Gothenburg
Välkommen till ett modernt och attraktivt kontor på tredje våningen i Lindholmen Science Park – en inspirerande miljö för både företag och individer som vill...
Areal
3 - 912 m2
Pris pr. md.
Ca. 5,000 EUR/mo
Område
Lundby, Gothenburg
Type
Office space
Coworking space in Berlin Treptow-Köpenick, Berlin
 More info
Coworking space in Berlin Treptow-Köpenick, Berlin
Helles, modernes und sehr ansprechendes Denkmalschutz Fabrik-Loft am Treptower Park, Berlin, barrierefrei, komplett oder ein Teilbereich, möbliert oder als F...
Areal
30 locations
Pris pr. md.
Ca. 50 EUR/mo
Område
Berlin Treptow-Köpenick, Berlin
Type
Coworking space
Warehouse in Kłodzki, Dolnośląskie
 More info
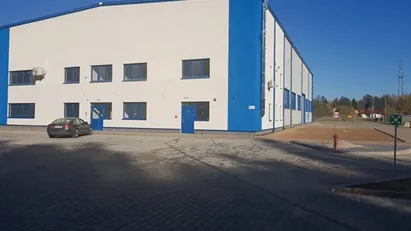
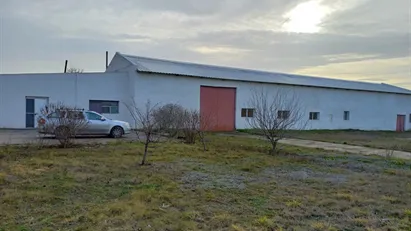
Warehouse in Kłodzki, Dolnośląskie
Perfect location at the Border:
Along national road No. 8.1.5 km from the Kudowa-Słone border crossing.Direct exit from national road No. 8_L
DESCRIPTION:...
Areal
Ca. 1,550 m2
Pris pr. md.
Ca. 15,000 EUR pr md
Område
Kłodzki, Dolnośląskie
Type
Warehouse
Office space in Lillehammer, Oppland
 More info
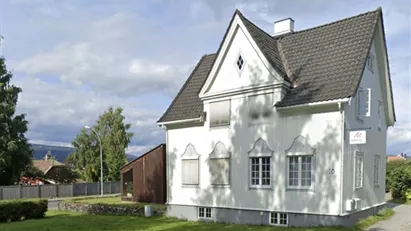
Office space in Lillehammer, Oppland
Office space for rent in Lillehammer, Oppland
Areal
Ca. 80 m2
Pris pr. md.
Ca. 850 EUR pr md
Område
Lillehammer, Oppland
Type
Office space
Coworking space in Sint-Niklaas, Oost-Vlaanderen
 More info
Coworking space in Sint-Niklaas, Oost-Vlaanderen
Finding a workspace for rent is quick and easy | Courtesy of MatchOffice
Are you looking for workspace for rent in Belgium? MatchOffice is not just a platfo...
Areal
1 - 30 locations
Pris pr. md.
Ca. 200 EUR/mo
Område
Sint-Niklaas, Oost-Vlaanderen
Type
Coworking space
Clinic in Venlo, Limburg
 More info
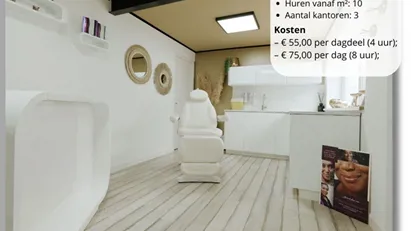
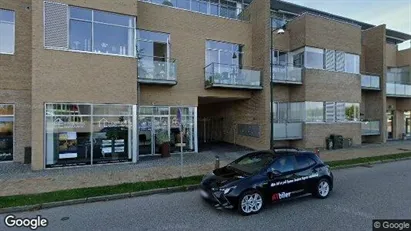
Clinic in Venlo, Limburg
Salon ruimte te huur in Venlo.
Deze moderne en volledig ingerichte salon ruimte te huur ligt dichtbij de snelweg gelegen aan een rustige straat met gratis...
Areal
Ca. 220 m2
Pris pr. md.
Ca. 50 EUR/mo
Område
Venlo, Limburg
Type
Clinic
Office space in Osijek, Osječko-Baranjska
 More info
Office space in Osijek, Osječko-Baranjska
2,5 floors, 7 rooms.
Current tenant has outgrown the space - an IT company with 25 employees.
Offices are prepared for network and office space.
400m2 ou...
Areal
Ca. 220 m2
Pris pr. md.
Ca. 1,000 EUR pr md
Område
Osijek, Osječko-Baranjska
Type
Office space
Warehouse in Mangalia, Sud-Est
 More info
Warehouse in Mangalia, Sud-Est
Warehouse for rent or sale Constanta, Mangalia
For rent or sale yard with 3 halls and direct entrance from DJ391.
The whole yard 1500 Euro + 16%, long ...
Areal
Ca. 1,500 m2
Pris pr. md.
Ca. 3,000 EUR pr md
Område
Mangalia, Sud-Est
Type
Warehouse
Industrial property in Sigtuna, Stockholm County
 More info
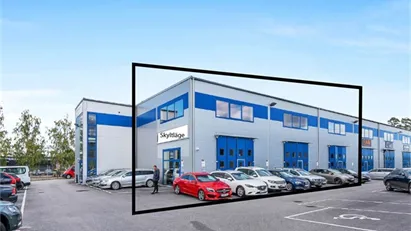
Industrial property in Sigtuna, Stockholm County
Denna artikel kan användas för kontor såväl som lagerförvaring. Varje enhet uppgår till 200 kvadratmeter med egen toalett och kök, totalt finns det 3 enheter...
Areal
200 - 600 m2
Pris pr. md.
Ca. 6,600 EUR pr md
Område
Sigtuna, Stockholm County
Type
Industrial property
Office space in Bury - Lancashire, North West
 More info
Office space in Bury - Lancashire, North West
Office space for rent in Bury - Lancashire, North West
Areal
-
Pris pr. md.
Ca. 450 GBP pr md
Område
Bury - Lancashire, North West
Type
Office space
Office space in Vejle, Vejle (region)
 More info
Office space in Vejle, Vejle (region)
Office space for rent in Vejle, Vejle (region)
Areal
Ca. 190 m2
Pris pr. md.
Ca. 11,950 DKK pr md
Område
Vejle, Vejle (region)
Type
Office space
Office space in Middelfart, Funen
 More info
Office space in Middelfart, Funen
Office space for rent in Middelfart, Funen
Areal
Ca. 2,035 m2
Pris pr. md.
Ca. 152,650 DKK pr md
Område
Middelfart, Funen
Type
Office space
Office space in Padborg, Region of Southern Denmark
 More info
Office space in Padborg, Region of Southern Denmark
Office space for rent in Padborg, Region of Southern Denmark
Areal
Ca. 2,080 m2
Pris pr. md.
Ca. 112,800 DKK pr md
Område
Padborg, Region of Southern Denmark
Type
Office space
Office space in Padborg, Region of Southern Denmark
 More info
Office space in Padborg, Region of Southern Denmark
Office space for rent in Padborg, Region of Southern Denmark
Areal
Ca. 790 m2
Pris pr. md.
Ca. 36,050 DKK pr md
Område
Padborg, Region of Southern Denmark
Type
Office space
Office space in Middelfart, Funen
 More info
Office space in Middelfart, Funen
Office space for rent in Middelfart, Funen
Areal
Ca. 110 m2
Pris pr. md.
Ca. 8,850 DKK pr md
Område
Middelfart, Funen
Type
Office space
Selected customers
30,000 customers use Companyspace.com
30,000 customers
285,000 companies in our database
2,400 rentals annually
Companyspace.com is used by thousands of landlords, property companies, commercial real estate agents, investors and business centres seeking greater visibility, more enquiries and lower vacancy rates.


