


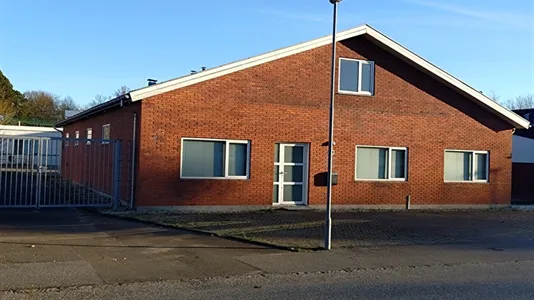

Producties for rent, Højbjerg, Aarhus,
, 8270 Højbjerg- Producties for rent
- Ca. 310 m2
- Ca. 12,500 DKK per month
![Producties for rent, Højbjerg, Aarhus, <span class="blurred street" onclick="ProcessAdRequest(2138977)"><span class="hint">See streetname</span>[xxxxxxxxxxxxx]</span>](https://cdkimages.rentbuyestate.com/photo/PreviewList/2635730.jpg?t=638988169170300000)
Producties for rent, Højbjerg, Aarhus,
Facts
Report- 2138977
- Producties
- Magazijnen
- Kantorruimte
- Ca. 310 m2
- Ca. 150,000 DKK
- Ca. 12,500 DKK
- Ca. 500 DKK
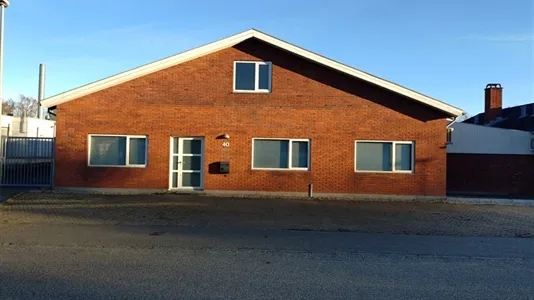
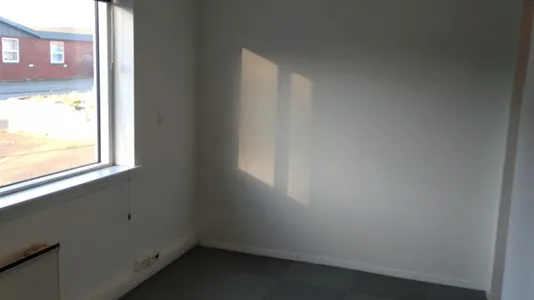
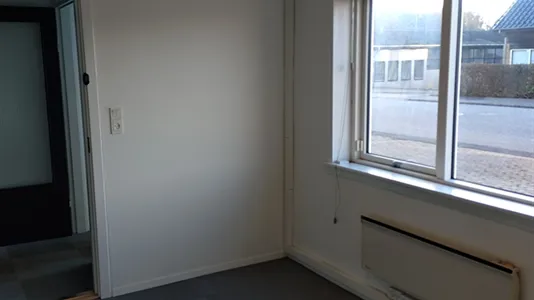
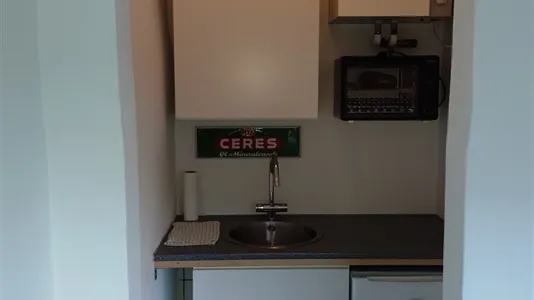
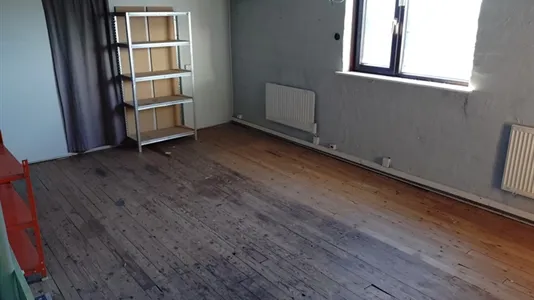
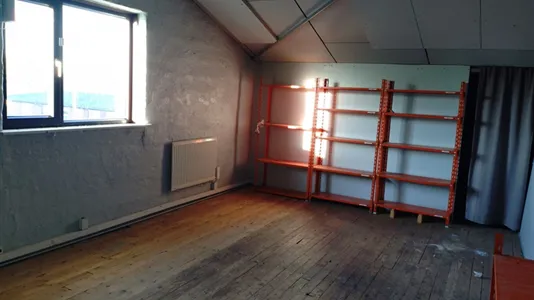
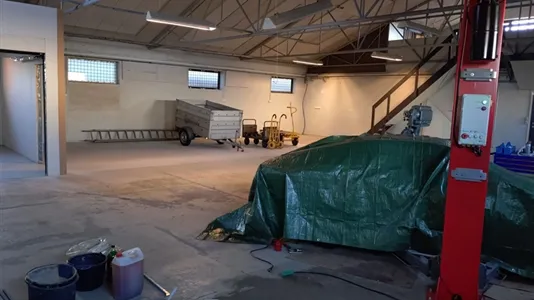
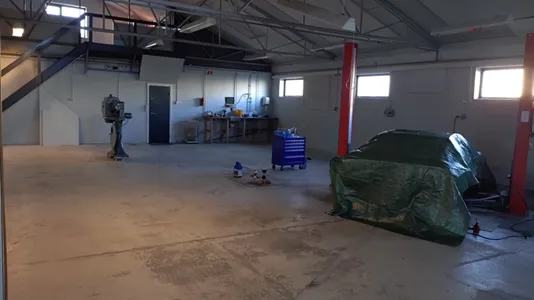
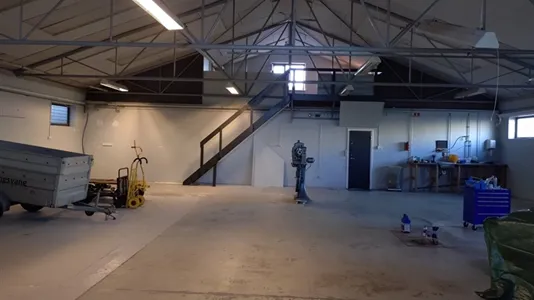
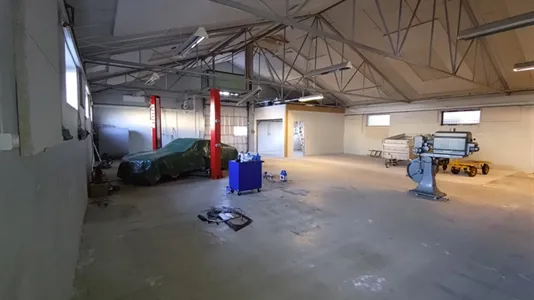
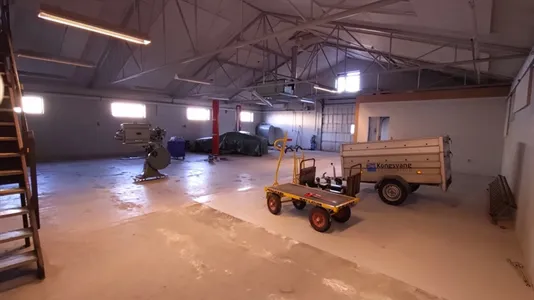
Kontor m. lager. Web shop mm.
65 m2 kontor og 245 m2 lager/værksted.
Gode parkeringsforhold, samt mulighed for eget reklameskilt.
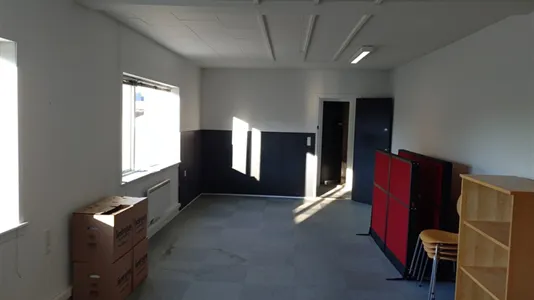
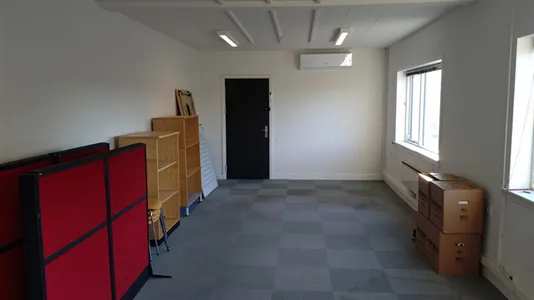
Indeholder lager/værksted m. stor port, storrumskontor, te-køkken, 1 stk. toilet, frokost/kopi, lager/diverse.
Betongulv i værksted, og tæpper i kontor.
Velegnet til installationsforretning, håndværker, web-shop, værksted (EL og VVS).
Lejemålet kan ikke anvendes til bilværksted.
Lejen tillægges driftsudgifter og moms.
Information and data
This company space that can be used as Producties or Magazijnen or as Kantorruimte, is located in Højbjerg. Højbjerg is located in in Aarhus. The company space is 310 m2 in total. You can rent this company space for Ca. 150,000 DKK per year.
Similar search results
-
Ca. 2,530 m2 kantorruimte for rent in Højbjerg, Aarhus

- Ca. 63,200 DKK per month
- Ca. 300 DKK /m2/year
-
Ca. 2,530 m2 kantorruimte for rent in Højbjerg, Aarhus

- Ca. 10,500,000 DKK per month
- Ca. 49,850 DKK /m2/year
-
Ca. 95 m2 winkels for rent in Højbjerg, Aarhus
- Ca. 7,500 DKK per month
- Ca. 950 DKK /m2/year
-
Ca. 135 m2 winkels for rent in Højbjerg, Aarhus
- Ca. 26,650 DKK per month
- Ca. 2,350 DKK /m2/year
-
Ca. 460 m2 winkels for rent in Højbjerg, Aarhus
- Ca. 80,950 DKK per month
- Ca. 2,100 DKK /m2/year
-
Ca. 430 m2 winkels for rent in Højbjerg, Aarhus
- Ca. 35,850 DKK per month
- Ca. 1,000 DKK /m2/year


Frequently asked questions
Statistics on the development of available industrial properties for rent in Højbjerg over the past month
Below you can see the development of available industrial properties for rent in Højbjerg over the past month. In the first column you see the date. In the second column you see the total amount of industrial properties for rent in Højbjerg on the date. In the third column you see the amount of new industrial properties in Højbjerg that was available for rent on the date. In the fourth column you see the amount of industrial properties in Højbjerg that was rented on the date. Also see aggregate statistics on all available industrial properties in Højbjerg over time, aggregate statistics on new industrial properties in Højbjerg over time, aggregate statistics on rented industrial properties in Højbjerg over time
| Date | All industrial properties for rent | New industrial properties for rent | Rented out industrial properties |
|---|---|---|---|
| 11. February 2026 | 7 | 0 | 0 |
| 10. February 2026 | 7 | 0 | 0 |
| 9. February 2026 | 7 | 0 | 0 |
| 8. February 2026 | 7 | 0 | 0 |
| 7. February 2026 | 7 | 0 | 0 |
| 6. February 2026 | 7 | 0 | 0 |
| 5. February 2026 | 7 | 0 | 0 |
| 4. February 2026 | 7 | 0 | 0 |
| 3. February 2026 | 7 | 0 | 0 |
| 2. February 2026 | 7 | 0 | 0 |
| 1. February 2026 | 7 | 0 | 0 |
| 31. January 2026 | 7 | 0 | 0 |
| 30. January 2026 | 7 | 0 | 0 |
| 29. January 2026 | 7 | 0 | 0 |
| 28. January 2026 | 7 | 0 | 0 |
| 27. January 2026 | 7 | 0 | 0 |
| 26. January 2026 | 7 | 0 | 0 |
| 25. January 2026 | 7 | 0 | 0 |
| 24. January 2026 | 7 | 0 | 0 |
| 23. January 2026 | 7 | 0 | 0 |
| 22. January 2026 | 7 | 0 | 0 |
| 21. January 2026 | 7 | 0 | 0 |
| 20. January 2026 | 7 | 0 | 0 |
| 19. January 2026 | 7 | 0 | 0 |
| 18. January 2026 | 7 | 0 | 0 |
| 17. January 2026 | 7 | 0 | 0 |
| 16. January 2026 | 7 | 0 | 0 |
| 15. January 2026 | 7 | 0 | 0 |
| 14. January 2026 | 7 | 0 | 0 |
| 13. January 2026 | 7 | 0 | 0 |
| 12. January 2026 | 7 | 0 | 0 |
Statistics on currently available industrial properties for rent in Højbjerg
In the table below, you see a series of data about available industrial properties to rent in Højbjerg.Also see gathered statistics of all available industrial properties in Højbjerg over time, the gathered statistics of new industrial properties in Højbjerg over time, the gathered statistics of rented industrial properties in Højbjerg over time
| Industrial properties | |
|---|---|
| Available premises | 7 |
| New premises since yesterday | 0 |
| Rented out premises since yesterday | 0 |
| Total available m2 | 5,274 |
| Average price per m2 per year without expenses | 62 |
| Highest price per m2 per year | 80 |
| Lowest price per m2 per year | 47 |