


Industrial properties in Højbjerg
Companyspace.com today:
New today 780
Updated 24h 1,062
Notifications about new companyspaces5
Copenhagen +4
Stockholm +24
Amsterdam +2
Brussels +3
Vienna +13
Paris +18
Dublin (county) +4
Warsaw +21
Roma (region) +4
Lisbon +1
Greater London +13
Latest update 1 min ago
Active ads 365,448
7 industrial properties found
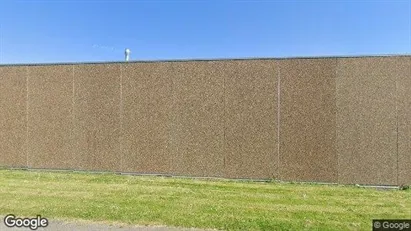
Warehouse in Højbjerg, Aarhus
 More info
Warehouse in Højbjerg, Aarhus
Warehouse for rent in Højbjerg, Aarhus
Areal
Ca. 430 m2
Pris pr. md.
Ca. 17,600 DKK pr md
Område
Højbjerg, Aarhus
Type
Warehouse
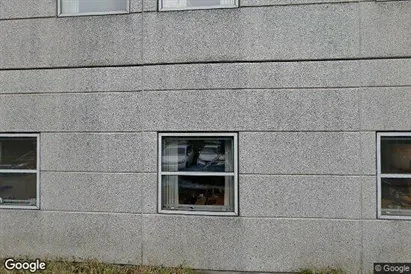
Warehouse in Højbjerg, Aarhus
 More info
Warehouse in Højbjerg, Aarhus
Warehouse for rent in Højbjerg, Aarhus
Areal
Ca. 675 m2
Pris pr. md.
Ca. 25,350 DKK pr md
Område
Højbjerg, Aarhus
Type
Warehouse
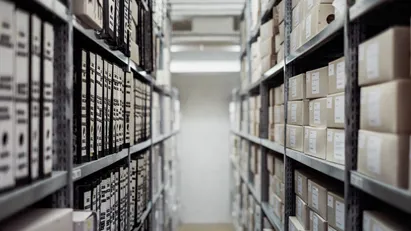
Office space in Højbjerg, Aarhus
 More info
Office space in Højbjerg, Aarhus
Office space for rent in Højbjerg, Aarhus
Areal
Ca. 1,130 m2
Pris pr. md.
Ca. 37,700 DKK pr md
Område
Højbjerg, Aarhus
Type
Office space
Office space in Højbjerg, Aarhus
 More info
Office space in Højbjerg, Aarhus
Office space for rent in Højbjerg, Aarhus
Areal
Ca. 2,230 m2
Pris pr. md.
Ca. 65,850 DKK pr md
Område
Højbjerg, Aarhus
Type
Office space
Warehouse in Højbjerg, Aarhus
 More info
Warehouse in Højbjerg, Aarhus
Warehouse for rent in Højbjerg, Aarhus
Areal
Ca. 55 m2
Pris pr. md.
Not stated
Område
Højbjerg, Aarhus
Type
Warehouse
Warehouse in Højbjerg, Aarhus
 More info
Warehouse in Højbjerg, Aarhus
Warehouse for rent in Højbjerg, Aarhus
Areal
Ca. 850 m2
Pris pr. md.
Not stated
Område
Højbjerg, Aarhus
Type
Warehouse
Warehouse property in Højbjerg, Aarhus
 More info
Warehouse property in Højbjerg, Aarhus
Warehouse for sale in Højbjerg, Aarhus
Areal
Ca. 1,175 m2
Pris
Not stated
Område
Højbjerg, Aarhus
Type
Warehouse
Selected customers
30,000 customers use Companyspace.com
30,000 customers
285,000 companies in our database
2,400 rentals annually
Companyspace.com is used by thousands of landlords, property companies, commercial real estate agents, investors and business centres seeking greater visibility, more enquiries and lower vacancy rates.


