


Commercial property for rent in Europe
There are 97,787 available commercial properties in Europe right now. Companyspace.com collects commercial properties from many different parts of the market, so that you as a company can more easily get an overview of available commercial properties in Europe.
Companyspace.com today:
New today 2,965
Updated 24h 3,471
Notifications about new companyspaces2,183
Copenhagen +6
Stockholm +10
Amsterdam +3
Berlin +3
Vienna +6
Paris +5
Madrid +4
Dublin (county) +23
Warsaw +19
Greater London +14
Latest update 17 min ago
Active ads 369,199
97,787 commercial properties found
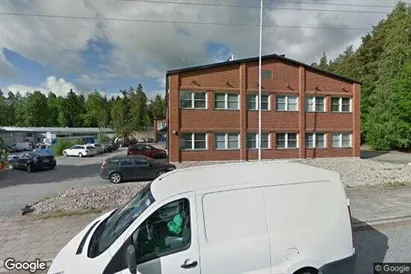
Commercial space in Turku, Varsinais-Suomi
 More info
Commercial space in Turku, Varsinais-Suomi
Commercial space for rent in Turku, Varsinais-Suomi
Areal
Ca. 145 m2
Pris pr. md.
Not stated
Område
Turku, Varsinais-Suomi
Type
Commercial property
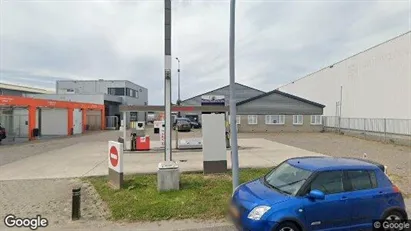
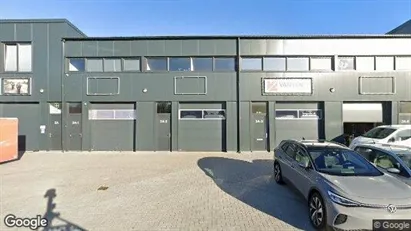
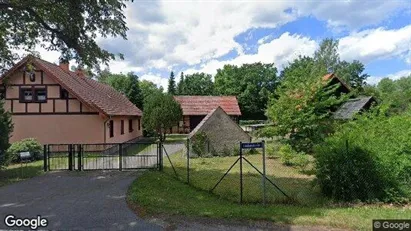
Commercial space in Maasdriel, Gelderland
 More info
Commercial space in Maasdriel, Gelderland
Commercial space for rent in Maasdriel, Gelderland
Areal
Ca. 375 m2
Pris pr. md.
Ca. 2,650 EUR pr md
Område
Maasdriel, Gelderland
Type
Commercial property
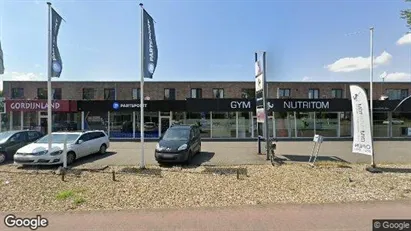
Commercial space in Lievegem, Oost-Vlaanderen
 More info
Commercial space in Lievegem, Oost-Vlaanderen
Commercial space for rent in Lievegem, Oost-Vlaanderen
Areal
Ca. 340 m2
Pris pr. md.
Ca. 100 EUR pr md
Område
Lievegem, Oost-Vlaanderen
Type
Commercial property
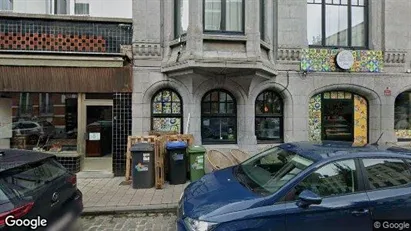
Commercial space in Stad Gent, Gent
 More info
Commercial space in Stad Gent, Gent
Commercial space for rent in Stad Gent, Gent
Areal
Ca. 90 m2
Pris pr. md.
Ca. 200 EUR pr md
Område
Stad Gent, Gent
Type
Commercial property
Commercial space in Groningen, Groningen (region)
 More info
Commercial space in Groningen, Groningen (region)
Commercial space for rent in Groningen, Groningen (region)
Areal
Ca. 45 m2
Pris pr. md.
Ca. 400 EUR pr md
Område
Groningen, Groningen (region)
Type
Commercial property
Commercial space in Enschede, Overijssel
 More info
Commercial space in Enschede, Overijssel
Commercial space for rent in Enschede, Overijssel
Areal
-
Pris pr. md.
Ca. 1,200 EUR pr md
Område
Enschede, Overijssel
Type
Commercial property
Commercial space in Dublin 8, Dublin
 More info
Commercial space in Dublin 8, Dublin
Commercial space for rent in Dublin 8, Dublin
Areal
Ca. 230 m2
Pris pr. md.
Ca. 2,500 EUR pr md
Område
Dublin 8, Dublin
Type
Commercial property
Commercial space in Oss, North Brabant
 More info
Commercial space in Oss, North Brabant
Commercial space for rent in Oss, North Brabant
Areal
Ca. 50 m2
Pris pr. md.
Ca. 50 EUR pr md
Område
Oss, North Brabant
Type
Commercial property
Commercial space in Huizen, North Holland
 More info
Commercial space in Huizen, North Holland
Commercial space for rent in Huizen, North Holland
Areal
-
Pris pr. md.
Ca. 4,250 EUR pr md
Område
Huizen, North Holland
Type
Commercial property
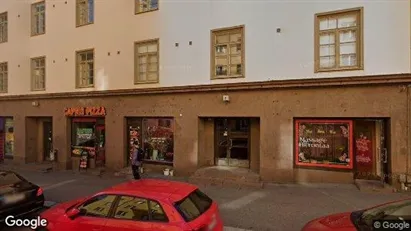
Commercial space in Helsinki Keskinen, Helsinki
 More info
Commercial space in Helsinki Keskinen, Helsinki
Commercial space Vuokrattavana sisälläHelsinki Keskinen, Helsinki
Areal
Ca. 30 m2
Pris pr. md.
Ca. 100 EUR pr md
Område
Helsinki Keskinen, Helsinki
Type
Commercial property
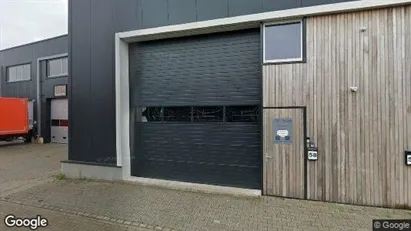
Commercial space in Enschede, Overijssel
 More info
Commercial space in Enschede, Overijssel
Commercial space te huur in Enschede, Overijssel
Areal
-
Pris pr. md.
Ca. 1,950 EUR pr md
Område
Enschede, Overijssel
Type
Commercial property
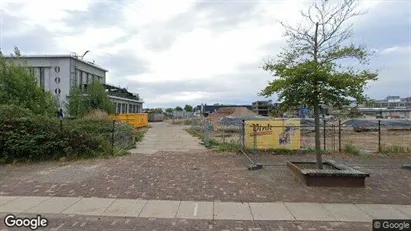
Commercial space in Vorpommern-Greifswald, Mecklenburg-Vorpommern
 More info
Commercial space in Vorpommern-Greifswald, Mecklenburg-Vorpommern
Commercial space for rent in Vorpommern-Greifswald, Mecklenburg-Vorpommern
Areal
Ca. 5,680 m2
Pris pr. md.
Not stated
Område
Vorpommern-Greifswald, Mecklenburg-Vorpommern
Type
Commercial property
Commercial space in Antwerp Deurne, Antwerp
 More info
Commercial space in Antwerp Deurne, Antwerp
Commercial space for rent in Antwerp Deurne, Antwerp
Areal
Ca. 755 m2
Pris pr. md.
Ca. 6,750 EUR pr md
Område
Antwerp Deurne, Antwerp
Type
Commercial property
Commercial space in Napoli Municipalità 5, Napoli
 More info
Commercial space in Napoli Municipalità 5, Napoli
Commercial space for rent in Napoli Municipalità 5, Napoli
Areal
-
Pris pr. md.
Ca. 1,300 EUR pr md
Område
Napoli Municipalità 5, Napoli
Type
Commercial property
Commercial space in Stad Gent, Gent
 More info
Commercial space in Stad Gent, Gent
Commercial space for rent in Stad Gent, Gent
Areal
-
Pris pr. md.
Ca. 200 EUR pr md
Område
Stad Gent, Gent
Type
Commercial property
Commercial space in Valby, Copenhagen
 More info
Commercial space in Valby, Copenhagen
Commercial space for rent in Valby, Copenhagen
Areal
Ca. 110 m2
Pris pr. md.
Ca. 19,000 DKK pr md
Område
Valby, Copenhagen
Type
Commercial property
Commercial space in Zaventem, Vlaams-Brabant
 More info
Commercial space in Zaventem, Vlaams-Brabant
Commercial space for rent in Zaventem, Vlaams-Brabant
Areal
Ca. 540 m2
Pris pr. md.
Ca. 3,000 EUR pr md
Område
Zaventem, Vlaams-Brabant
Type
Commercial property
Commercial space in Hengelo, Overijssel
 More info
Commercial space in Hengelo, Overijssel
Commercial space for rent in Hengelo, Overijssel
Areal
Ca. 80 m2
Pris pr. md.
Ca. 1,050 EUR pr md
Område
Hengelo, Overijssel
Type
Commercial property
Selected customers
30,000 customers use Companyspace.com
30,000 customers
285,000 companies in our database
2,400 rentals annually
Companyspace.com is used by thousands of landlords, property companies, commercial real estate agents, investors and business centres seeking greater visibility, more enquiries and lower vacancy rates.


