


Commercial property for rent in Europe
There are 97,340 available commercial properties in Europe right now. Companyspace.com collects commercial properties from many different parts of the market, so that you as a company can more easily get an overview of available commercial properties in Europe.
Companyspace.com today:
New today 157
Updated 24h 184
Notifications about new companyspaces2,196
Copenhagen +4
Stockholm +1
Berlin +8
Vienna +4
Paris +3
Dublin (county) +2
Latest update 1 min ago
Active ads 370,756
97,340 commercial properties found
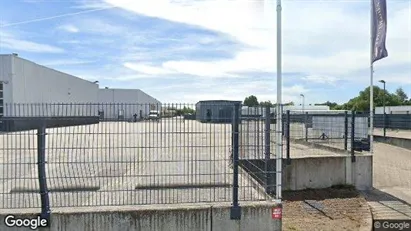
Commercial space in Oldenzaal, Overijssel
 More info
Commercial space in Oldenzaal, Overijssel
Commercial space te huur in Oldenzaal, Overijssel
Areal
-
Pris pr. md.
Ca. 2,650 EUR pr md
Område
Oldenzaal, Overijssel
Type
Commercial property
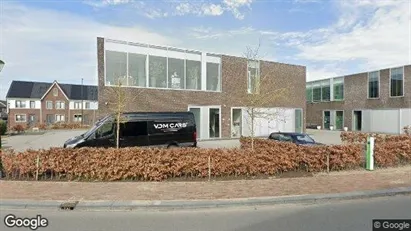
Commercial space in Blaricum, North Holland
 More info
Commercial space in Blaricum, North Holland
Commercial space for rent in Blaricum, North Holland
Areal
Ca. 170 m2
Pris pr. md.
Ca. 3,250 EUR pr md
Område
Blaricum, North Holland
Type
Commercial property
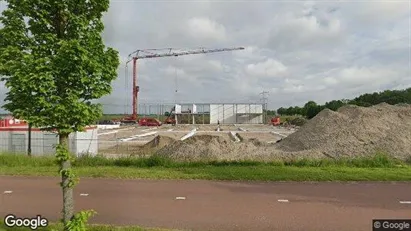
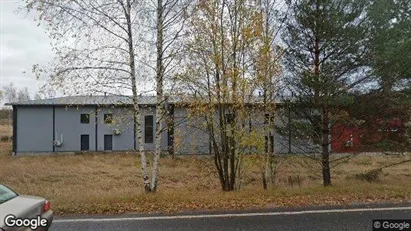
Commercial space in Järvenpää, Uusimaa
 More info
Commercial space in Järvenpää, Uusimaa
Commercial space Vuokrattavana sisälläJärvenpää, Uusimaa
Areal
Ca. 85 m2
Pris pr. md.
Ca. 1,650 EUR pr md
Område
Järvenpää, Uusimaa
Type
Commercial property
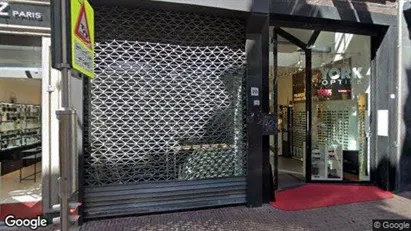
Commercial space in Amsterdam Centrum, Amsterdam
 More info
Commercial space in Amsterdam Centrum, Amsterdam
Commercial space for rent in Amsterdam Centrum, Amsterdam
Areal
Ca. 155 m2
Pris pr. md.
Ca. 18,350 EUR pr md
Område
Amsterdam Centrum, Amsterdam
Type
Commercial property
Commercial space in Oulu, Pohjois-Pohjanmaa
 More info
Commercial space in Oulu, Pohjois-Pohjanmaa
Commercial space for rent in Oulu, Pohjois-Pohjanmaa
Areal
Ca. 230 m2
Pris pr. md.
Ca. 2,300 EUR pr md
Område
Oulu, Pohjois-Pohjanmaa
Type
Commercial property
Commercial space in Halderberge, North Brabant
 More info
Commercial space in Halderberge, North Brabant
Commercial space for rent in Halderberge, North Brabant
Areal
Ca. 200 m2
Pris pr. md.
Ca. 1,950 EUR pr md
Område
Halderberge, North Brabant
Type
Commercial property
Commercial space in Alkmaar, North Holland
 More info
Commercial space in Alkmaar, North Holland
Commercial space for rent in Alkmaar, North Holland
Areal
Ca. 90 m2
Pris pr. md.
Ca. 1,500 EUR pr md
Område
Alkmaar, North Holland
Type
Commercial property
Commercial space in Lier, Antwerp (Province)
 More info
Commercial space in Lier, Antwerp (Province)
Commercial space for rent in Lier, Antwerp (Province)
Areal
-
Pris pr. md.
Ca. 100 EUR pr md
Område
Lier, Antwerp (Province)
Type
Commercial property
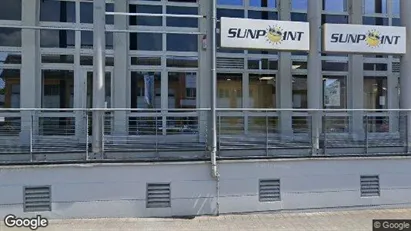
Commercial space in Helsinki Eteläinen, Helsinki
 More info
Commercial space in Helsinki Eteläinen, Helsinki
Commercial space for rent in Helsinki Eteläinen, Helsinki
Areal
Ca. 40 m2
Pris pr. md.
Ca. 900 EUR pr md
Område
Helsinki Eteläinen, Helsinki
Type
Commercial property
Commercial space in Venlo, Limburg
 More info
Commercial space in Venlo, Limburg
Commercial space for rent in Venlo, Limburg
Areal
Ca. 250 m2
Pris pr. md.
Ca. 1,950 EUR pr md
Område
Venlo, Limburg
Type
Commercial property
Commercial space in Zeewolde, Flevoland
 More info
Commercial space in Zeewolde, Flevoland
Commercial space for rent in Zeewolde, Flevoland
Areal
Ca. 485 m2
Pris pr. md.
Ca. 2,900 EUR pr md
Område
Zeewolde, Flevoland
Type
Commercial property
Commercial space in Pori, Satakunta
 More info
Commercial space in Pori, Satakunta
Commercial space for rent in Pori, Satakunta
Areal
Ca. 40 m2
Pris pr. md.
Ca. 450 EUR pr md
Område
Pori, Satakunta
Type
Commercial property
Commercial space in Doetinchem, Gelderland
 More info
Commercial space in Doetinchem, Gelderland
TE HUUR - Fabriekstraat 42 in Doetinchem
Moderne kantoor/showroom ruimte met magazijn, uitstekend gelegen op bedrijventerrein "Verheulsweide" in Doetinc...
Areal
-
Pris pr. md.
Ca. 3,750 EUR pr md
Område
Doetinchem, Gelderland
Type
Commercial property
Commercial space in Kirkkonummi, Uusimaa
 More info
Commercial space in Kirkkonummi, Uusimaa
Commercial space for rent in Kirkkonummi, Uusimaa
Areal
Ca. 145 m2
Pris pr. md.
Ca. 1,550 EUR pr md
Område
Kirkkonummi, Uusimaa
Type
Commercial property
Commercial space in Eifelkreis Bitburg-Prüm, Rheinland-Pfalz
 More info
Commercial space in Eifelkreis Bitburg-Prüm, Rheinland-Pfalz
Commercial space for rent in Eifelkreis Bitburg-Prüm, Rheinland-Pfalz
Areal
Ca. 190 m2
Pris pr. md.
Ca. 480,000 EUR pr md
Område
Eifelkreis Bitburg-Prüm, Rheinland-Pfalz
Type
Commercial property
Commercial space in Lansingerland, South Holland
 More info
Commercial space in Lansingerland, South Holland
Commercial space for rent in Lansingerland, South Holland
Areal
Ca. 220 m2
Pris pr. md.
Ca. 1,950 EUR pr md
Område
Lansingerland, South Holland
Type
Commercial property
Commercial space in Ouder-Amstel, North Holland
 More info
Commercial space in Ouder-Amstel, North Holland
Commercial space for rent in Ouder-Amstel, North Holland
Areal
Ca. 375 m2
Pris pr. md.
Ca. 8,350 EUR pr md
Område
Ouder-Amstel, North Holland
Type
Commercial property
Commercial space in Meppel, Drenthe
 More info
Commercial space in Meppel, Drenthe
Commercial space for rent in Meppel, Drenthe
Areal
Ca. 285 m2
Pris pr. md.
Not stated
Område
Meppel, Drenthe
Type
Commercial property
Selected customers
30,000 customers use Companyspace.com
30,000 customers
285,000 companies in our database
2,400 rentals annually
Companyspace.com is used by thousands of landlords, property companies, commercial real estate agents, investors and business centres seeking greater visibility, more enquiries and lower vacancy rates.


