


Commercial property for rent in Europe
There are 97,306 available commercial properties in Europe right now. Companyspace.com collects commercial properties from many different parts of the market, so that you as a company can more easily get an overview of available commercial properties in Europe.
Companyspace.com today:
Updated 24h 1,091
Latest update 3 min ago
Active ads 369,940
97,306 commercial properties found
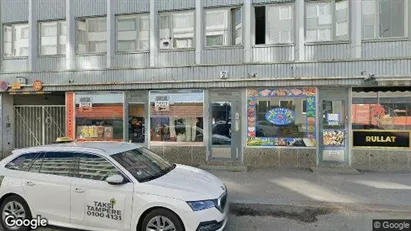
Commercial space in Tampere Keskinen, Tampere
 More info
Commercial space in Tampere Keskinen, Tampere
Commercial space for rent in Tampere Keskinen, Tampere
Areal
Ca. 60 m2
Pris pr. md.
Not stated
Område
Tampere Keskinen, Tampere
Type
Commercial property
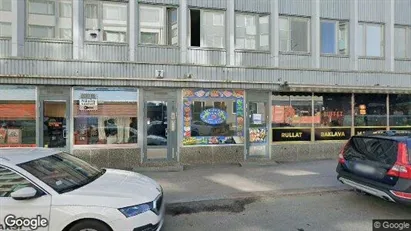
Commercial space in Tampere Keskinen, Tampere
 More info
Commercial space in Tampere Keskinen, Tampere
Commercial space for rent in Tampere Keskinen, Tampere
Areal
-
Pris pr. md.
Ca. 1,000 EUR pr md
Område
Tampere Keskinen, Tampere
Type
Commercial property
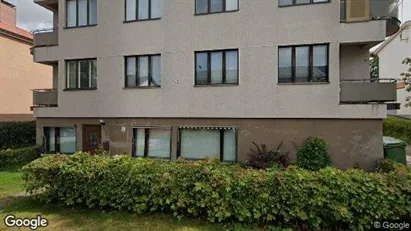
Commercial space in Porvoo, Uusimaa
 More info
Commercial space in Porvoo, Uusimaa
Commercial space Vuokrattavana sisälläPorvoo, Uusimaa
Areal
Ca. 60 m2
Pris pr. md.
Ca. 6,000 EUR pr md
Område
Porvoo, Uusimaa
Type
Commercial property
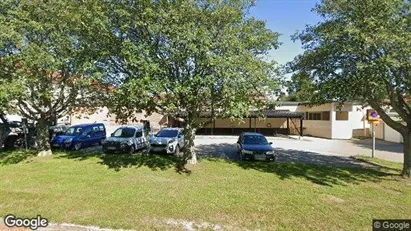
Commercial space in Hudiksvall, Gävleborg County
 More info
Commercial space in Hudiksvall, Gävleborg County
Commercial space for rent in Hudiksvall, Gävleborg County
Areal
Ca. 10 m2
Pris pr. md.
Ca. 2,300 SEK pr md
Område
Hudiksvall, Gävleborg County
Type
Commercial property
Commercial space in Hudiksvall, Gävleborg County
 More info
Commercial space in Hudiksvall, Gävleborg County
Commercial space for rent in Hudiksvall, Gävleborg County
Areal
Ca. 20 m2
Pris pr. md.
Ca. 3,400 SEK pr md
Område
Hudiksvall, Gävleborg County
Type
Commercial property
Commercial space in Hudiksvall, Gävleborg County
More info
Commercial space in Hudiksvall, Gävleborg County
Commercial space for rent in Hudiksvall, Gävleborg County
Areal
Ca. 20 m2
Pris pr. md.
Ca. 3,600 SEK pr md
Område
Hudiksvall, Gävleborg County
Type
Commercial property
Commercial space in Frankfurt Bergen-Enkheim, Frankfurt (region)
 More info
Commercial space in Frankfurt Bergen-Enkheim, Frankfurt (region)
Commercial space for rent in Frankfurt Bergen-Enkheim, Frankfurt (region)
Areal
Ca. 405 m2
Pris pr. md.
Not stated
Område
Frankfurt Bergen-Enkheim, Frankfurt (region)
Type
Commercial property
Commercial space in Haderslev, Region of Southern Denmark
More info
Commercial space in Haderslev, Region of Southern Denmark
Commercial space for rent in Haderslev, Region of Southern Denmark
Areal
Ca. 5 m2
Pris pr. md.
Ca. 300 DKK pr md
Område
Haderslev, Region of Southern Denmark
Type
Commercial property
Commercial space in Kerava, Uusimaa
 More info
Commercial space in Kerava, Uusimaa
Commercial space Vuokrattavana sisälläKerava, Uusimaa
Areal
Ca. 175 m2
Pris pr. md.
Ca. 10,750 EUR pr md
Område
Kerava, Uusimaa
Type
Commercial property
Commercial space in Den Bosch, North Brabant
 More info
Commercial space in Den Bosch, North Brabant
Commercial space for rent in Den Bosch, North Brabant
Areal
Ca. 220 m2
Pris pr. md.
Ca. 4,500 EUR pr md
Område
Den Bosch, North Brabant
Type
Commercial property
Commercial space in Hudiksvall, Gävleborg County
More info
Commercial space in Hudiksvall, Gävleborg County
Commercial space for rent in Hudiksvall, Gävleborg County
Areal
Ca. 5 m2
Pris pr. md.
Ca. 1,300 SEK pr md
Område
Hudiksvall, Gävleborg County
Type
Commercial property
Commercial space in Herentals, Antwerp (Province)
 More info
Commercial space in Herentals, Antwerp (Province)
Commercial space for rent in Herentals, Antwerp (Province)
Areal
Ca. 80 m2
Pris pr. md.
Ca. 1,350 EUR pr md
Område
Herentals, Antwerp (Province)
Type
Commercial property
Commercial space in Oldenzaal, Overijssel
 More info
Commercial space in Oldenzaal, Overijssel
Commercial space for rent in Oldenzaal, Overijssel
Areal
Ca. 210 m2
Pris pr. md.
Ca. 3,950 EUR pr md
Område
Oldenzaal, Overijssel
Type
Commercial property
Commercial space in Den Bosch, North Brabant
 More info
Commercial space in Den Bosch, North Brabant
Commercial space for rent in Den Bosch, North Brabant
Areal
Ca. 165 m2
Pris pr. md.
Ca. 2,700 EUR pr md
Område
Den Bosch, North Brabant
Type
Commercial property
Commercial space in Frankfurt Innenstadt I, Frankfurt (region)
 More info
Commercial space in Frankfurt Innenstadt I, Frankfurt (region)
Commercial space for rent in Frankfurt Innenstadt I, Frankfurt (region)
Areal
Ca. 205 m2
Pris pr. md.
Not stated
Område
Frankfurt Innenstadt I, Frankfurt (region)
Type
Commercial property
Commercial space in Hörby, Skåne County
More info
Commercial space in Hörby, Skåne County
Commercial space for rent in Hörby, Skåne County
Areal
Ca. 5 m2
Pris pr. md.
Ca. 700 SEK pr md
Område
Hörby, Skåne County
Type
Commercial property
Commercial space in Hudiksvall, Gävleborg County
More info
Commercial space in Hudiksvall, Gävleborg County
Commercial space for rent in Hudiksvall, Gävleborg County
Areal
Ca. 10 m2
Pris pr. md.
Ca. 1,700 SEK pr md
Område
Hudiksvall, Gävleborg County
Type
Commercial property
Commercial space in Oldenzaal, Overijssel
 More info
Commercial space in Oldenzaal, Overijssel
Commercial space for rent in Oldenzaal, Overijssel
Areal
Ca. 100 m2
Pris pr. md.
Ca. 2,700 EUR pr md
Område
Oldenzaal, Overijssel
Type
Commercial property
Selected customers
30,000 customers use Companyspace.com
30,000 customers
285,000 companies in our database
2,400 rentals annually
Companyspace.com is used by thousands of landlords, property companies, commercial real estate agents, investors and business centres seeking greater visibility, more enquiries and lower vacancy rates.


