


Photo provided by Google Street View and may be inaccurate:
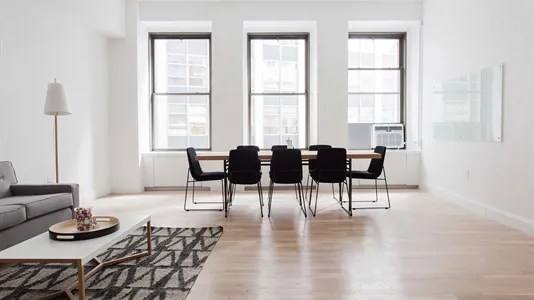
Commercial space for rent, Mol, Antwerp (Province), Statiestraat 38
Statiestraat 38, Mol- Commercial space for rent
- Ca. 3,150 EUR per month

Statiestraat 38, Mol
- Commercial space for rent
- Ca. 3,150 EUR per month
GET MORE INFO NOW
View all details about the premise and get direct access to the landlord’s contact information.


