


Commercial space for rent, Les Sables-d'Olonne, Pays de la Loire, Street not specified
Street not specified, Les Sables-d'Olonne- Commercial space for rent
- 1 m2
- 1,723 EUR per month

- Commercial space for rent
- 1 m2
- 1,723 EUR per month
⚡ View all details about the space and get direct access to the landlord’s contact information.
Commercial space for rent, Les Sables-d'Olonne, Pays de la Loire, Street not specified
Commercial space for rent in Les Sables-d'Olonne, Pays de la Loire
Information and data
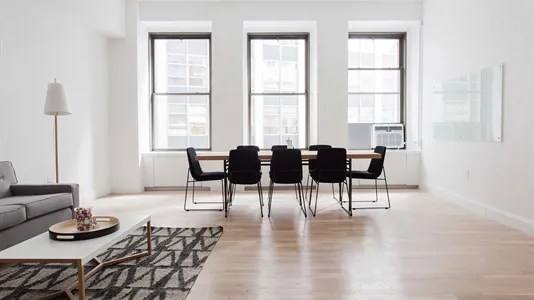
This company space that can be used as Commercial space, is located in Les Sables-d'Olonne. Les Sables-d'Olonne is located in in Pays de la Loire. The company space is 1 m2 in total. You can rent this company space for 20,676 EUR per year.
Similar search results
-
202 m2 commercial space for rent in Les Sables-d'Olonne, Pays de la Loire
- 3,900 EUR per month
- 231.68 EUR /m2/year
-
266 m2 commercial space for rent in Les Sables-d'Olonne, Pays de la Loire
- 4,700 EUR per month
- 212.03 EUR /m2/year
-
400 m2 commercial space for rent in Les Sables-d'Olonne, Pays de la Loire
- 56,000 EUR per month
- 1,680 EUR /m2/year
-
124 m2 restaurant for rent in Les Sables-d'Olonne, Pays de la Loire
- 1,833 EUR per month
- 177.39 EUR /m2/year
-
80 m2 office space for rent in Les Sables-d'Olonne, Pays de la Loire
- 1,800 EUR per month
- 270 EUR /m2/year
-
109 m2 office space for rent in Les Sables-d'Olonne, Pays de la Loire
- 1,370 EUR per month
- 150.83 EUR /m2/year
-
200 m2 restaurant for rent in Les Sables-d'Olonne, Pays de la Loire
- 1,800 EUR per month
- 108 EUR /m2/year


Frequently asked questions
Statistics on the development of available commercial properties for rent in Les Sables-d'Olonne over the past month
Below you can see the development of available commercial properties for rent in Les Sables-d'Olonne over the past month. In the first column you see the date. In the second column you see the total amount of commercial properties for rent in Les Sables-d'Olonne on the date. In the third column you see the amount of new commercial properties in Les Sables-d'Olonne that was available for rent on the date. In the fourth column you see the amount of commercial properties in Les Sables-d'Olonne that was rented on the date. Also see aggregate statistics on all available commercial properties in Les Sables-d'Olonne over time, aggregate statistics on new commercial properties in Les Sables-d'Olonne over time, aggregate statistics on rented commercial properties in Les Sables-d'Olonne over time
| Date | All commercial properties for rent | New commercial properties for rent | Rented out commercial properties |
|---|---|---|---|
| 24. November 2025 | 21 | 1 | 1 |
| 23. November 2025 | 21 | 3 | 2 |
| 22. November 2025 | 20 | 3 | 0 |
| 21. November 2025 | 17 | 0 | 0 |
| 20. November 2025 | 17 | 0 | 0 |
| 19. November 2025 | 17 | 0 | 0 |
| 18. November 2025 | 17 | 0 | 0 |
| 17. November 2025 | 17 | 0 | 0 |
| 16. November 2025 | 17 | 0 | 0 |
| 15. November 2025 | 17 | 0 | 0 |
| 14. November 2025 | 17 | 0 | 1 |
| 13. November 2025 | 18 | 1 | 0 |
| 12. November 2025 | 17 | 0 | 1 |
| 11. November 2025 | 18 | 0 | 0 |
| 10. November 2025 | 18 | 2 | 2 |
| 9. November 2025 | 18 | 2 | 0 |
| 8. November 2025 | 16 | 0 | 3 |
| 7. November 2025 | 19 | 0 | 0 |
| 6. November 2025 | 19 | 0 | 0 |
| 5. November 2025 | 19 | 0 | 1 |
| 4. November 2025 | 20 | 0 | 0 |
| 3. November 2025 | 20 | 0 | 0 |
| 2. November 2025 | 20 | 0 | 0 |
| 1. November 2025 | 20 | 0 | 0 |
| 31. October 2025 | 20 | 0 | 0 |
| 30. October 2025 | 20 | 0 | 0 |
| 29. October 2025 | 20 | 0 | 0 |
| 28. October 2025 | 20 | 0 | 0 |
| 27. October 2025 | 20 | 0 | 0 |
| 26. October 2025 | 20 | 0 | 0 |
| 25. October 2025 | 20 | 0 | 0 |
Statistics on currently available commercial properties for rent in Les Sables-d'Olonne
In the table below, you see a series of data about available commercial properties to rent in Les Sables-d'Olonne.Also see gathered statistics of all available commercial properties in Les Sables-d'Olonne over time, the gathered statistics of new commercial properties in Les Sables-d'Olonne over time, the gathered statistics of rented commercial properties in Les Sables-d'Olonne over time
| Commercial properties | |
|---|---|
| Available premises | 21 |
| New premises since yesterday | 1 |
| Rented out premises since yesterday | 1 |
| Total available m2 | 5,096 |
| Average price per m2 per year without expenses | 3,703 |
| Highest price per m2 per year | 30,300 |
| Lowest price per m2 per year | 68.89 |