


Photo provided by Google Street View and may be inaccurate:
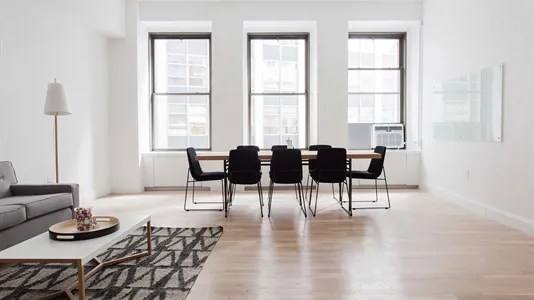
Commercial space for rent, Bourg-en-Bresse, Auvergne-Rhône-Alpes
- Ca. 280 m2
- Ca. 1,500 EUR per month

GET MORE INFO NOW
View all details about the premise and get direct access to the landlord’s contact information.
Commercial space for rent, Bourg-en-Bresse, Auvergne-Rhône-Alpes

Ca. 280m2

Ca. 1,500 EUR

Commercial space

Bourg-en-Bresse, Auvergne-Rhône-Alpes
Facts
- 3441216
- Commercial space
- 22.07.2026
- Ca. 280 m2
- Ca. 18,000 EUR
- Ca. 1,500 EUR
- Ca. 50 EUR
Similar search results
Commercial space in Bourg-en-Bresse, Auvergne-Rhône-Alpes
More info
We monitor the market!
Commercial space in Bourg-en-Bresse, Auvergne-Rhône-Alpes
Commercial space À loueren em wBourg-en-Bresse, Auvergne-Rhône-Alpes
Areal
Ca. 50 m2
Pris pr. md.
Ca. 750 EUR pr md
Område
Bourg-en-Bresse, Auvergne-Rhône-Alpes
Type
Commercial property
Commercial property in Bourg-en-Bresse, Auvergne-Rhône-Alpes
More info
We monitor the market!
Commercial property in Bourg-en-Bresse, Auvergne-Rhône-Alpes
Commercial property À vendreen em wBourg-en-Bresse, Auvergne-Rhône-Alpes
Areal
-
Pris
Ca. 421,000EUR
Område
Bourg-en-Bresse, Auvergne-Rhône-Alpes
Type
Commercial property
Commercial space in Bourg-en-Bresse, Auvergne-Rhône-Alpes
More info
We monitor the market!
Commercial space in Bourg-en-Bresse, Auvergne-Rhône-Alpes
Commercial space À loueren em wBourg-en-Bresse, Auvergne-Rhône-Alpes
Areal
Ca. 300 m2
Pris pr. md.
Ca. 3,300 EUR pr md
Område
Bourg-en-Bresse, Auvergne-Rhône-Alpes
Type
Commercial property
Commercial space in Bourg-en-Bresse, Auvergne-Rhône-Alpes
More info
We monitor the market!
Commercial space in Bourg-en-Bresse, Auvergne-Rhône-Alpes
Commercial space À loueren em wBourg-en-Bresse, Auvergne-Rhône-Alpes
Areal
Ca. 175 m2
Pris pr. md.
Ca. 2,150 EUR pr md
Område
Bourg-en-Bresse, Auvergne-Rhône-Alpes
Type
Commercial property
Commercial space in Bourg-en-Bresse, Auvergne-Rhône-Alpes
More info
We monitor the market!
Commercial space in Bourg-en-Bresse, Auvergne-Rhône-Alpes
Commercial space À loueren em wBourg-en-Bresse, Auvergne-Rhône-Alpes
Areal
Ca. 505 m2
Pris pr. md.
Ca. 3,000 EUR pr md
Område
Bourg-en-Bresse, Auvergne-Rhône-Alpes
Type
Commercial property
Office space in Bourg-en-Bresse, Auvergne-Rhône-Alpes
More info
We monitor the market!
Office space in Bourg-en-Bresse, Auvergne-Rhône-Alpes
Bureau À loueren em wBourg-en-Bresse, Auvergne-Rhône-Alpes
Areal
Ca. 245 m2
Pris pr. md.
Ca. 2,500 EUR pr md
Område
Bourg-en-Bresse, Auvergne-Rhône-Alpes
Type
Office space
Warehouse in Bourg-en-Bresse, Auvergne-Rhône-Alpes
More info
We monitor the market!
Warehouse in Bourg-en-Bresse, Auvergne-Rhône-Alpes
Entrepôt À loueren em wBourg-en-Bresse, Auvergne-Rhône-Alpes
Areal
Ca. 640 m2
Pris pr. md.
Ca. 3,150 EUR pr md
Område
Bourg-en-Bresse, Auvergne-Rhône-Alpes
Type
Warehouse
Warehouse in Bourg-en-Bresse, Auvergne-Rhône-Alpes
More info
We monitor the market!
Warehouse in Bourg-en-Bresse, Auvergne-Rhône-Alpes
Entrepôt À loueren em wBourg-en-Bresse, Auvergne-Rhône-Alpes
Areal
Ca. 130 m2
Pris pr. md.
Ca. 1,100 EUR pr md
Område
Bourg-en-Bresse, Auvergne-Rhône-Alpes
Type
Warehouse
Warehouse property in Bourg-en-Bresse, Auvergne-Rhône-Alpes
More info
We monitor the market!
Warehouse property in Bourg-en-Bresse, Auvergne-Rhône-Alpes
Entrepôt À vendreen em wBourg-en-Bresse, Auvergne-Rhône-Alpes
Areal
-
Pris
Ca. 192,000EUR
Område
Bourg-en-Bresse, Auvergne-Rhône-Alpes
Type
Warehouse
Selected customers
30,000 customers use Companyspace.com
30,000 customers
285,000 companies in our database
2,400 rentals annually
Companyspace.com is used by thousands of landlords, property companies, commercial real estate agents, investors and business centres seeking greater visibility, more enquiries and lower vacancy rates.


