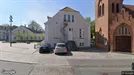
Clinic for rent, Silkeborg, Central Jutland Region,
, 8600 Silkeborg- Clinic for rent
- Ca. 20 m2
- Ca. 2,150 DKK per month
Clinic for rent, Silkeborg, Central Jutland Region,
Facts
Report- 3786268
- Clinic
- Office space
- Ca. 20 m2
- Ca. 26,000 DKK
- Ca. 2,150 DKK
- Ca. 26,000 DKK
- Ca. 2,150 DKK
- Ca. 1,300 DKK
- Ca. 1,300 DKK
Clinic for rent in Silkeborg, Central Jutland Region
Information and data
This clinic for rent, that can also be used as Office space, that is located in Silkeborg. Silkeborg is located in Central Jutland Region. The company space is 20 m2 in total. You can rent this clinic for Ca. 26,000 DKK per year.
Similar search results
-
Ca. 10 m2 clinic for rent in Silkeborg, Central Jutland Region
- Ca. 3,000 DKK per month
- Ca. 3,000 DKK /m2/year
-
Ca. 30 m2 clinic for rent in Silkeborg, Central Jutland Region
- Ca. 5,000 DKK per month
- Ca. 2,000 DKK /m2/year
-
Ca. 635 m2 industrial property for rent in Silkeborg, Central Jutland Region
- Ca. 12,000 DKK per month
- Ca. 250 DKK /m2/year
-
Ca. 260 m2 office space for rent in Silkeborg, Central Jutland Region
- Ca. 21,200 DKK per month
- Ca. 1,000 DKK /m2/year
-
Ca. 1,030 m2 office space for rent in Silkeborg, Central Jutland Region
- Ca. 107,500 DKK per month
- Ca. 1,250 DKK /m2/year
-
Ca. 165 m2 shop for rent in Silkeborg, Central Jutland Region
- Ca. 22,250 DKK per month
- Ca. 1,600 DKK /m2/year
-
Ca. 1,355 m2 warehouse for rent in Silkeborg, Central Jutland Region
- Ca. 28,250 DKK per month
- Ca. 250 DKK /m2/year
-
Ca. 1,535 m2 warehouse for rent in Silkeborg, Central Jutland Region
- Ca. 66,650 DKK per month
- Ca. 500 DKK /m2/year
Frequently asked questions
Statistics on the development of available clinics for rent in Silkeborg over the past month
Below you can see the development of available clinics for rent in Silkeborg over the past month. In the first column you see the date. In the second column you see the total amount of clinics for rent in Silkeborg on the date. In the third column you see the amount of new clinics in Silkeborg that was available for rent on the date. In the fourth column you see the amount of clinics in Silkeborg that was rented on the date. Also see aggregate statistics on all available clinics in Silkeborg over time, aggregate statistics on new clinics in Silkeborg over time, aggregate statistics on rented clinics in Silkeborg over time
| Date | All clinics for rent | New clinics for rent | Rented out clinics |
|---|---|---|---|
| 17. February 2026 | 12 | 1 | 0 |
| 16. February 2026 | 11 | 0 | 0 |
| 15. February 2026 | 11 | 0 | 0 |
| 14. February 2026 | 11 | 0 | 0 |
| 13. February 2026 | 11 | 0 | 0 |
| 12. February 2026 | 11 | 0 | 0 |
| 11. February 2026 | 11 | 0 | 0 |
| 10. February 2026 | 11 | 0 | 0 |
| 9. February 2026 | 11 | 0 | 0 |
| 8. February 2026 | 11 | 0 | 0 |
| 7. February 2026 | 11 | 0 | 0 |
| 6. February 2026 | 11 | 0 | 0 |
| 5. February 2026 | 11 | 1 | 1 |
| 4. February 2026 | 11 | 1 | 0 |
| 3. February 2026 | 10 | 1 | 0 |
| 2. February 2026 | 9 | 1 | 0 |
| 1. February 2026 | 8 | 1 | 0 |
| 31. January 2026 | 7 | 0 | 0 |
| 30. January 2026 | 7 | 0 | 0 |
| 29. January 2026 | 7 | 0 | 0 |
| 28. January 2026 | 7 | 0 | 0 |
| 27. January 2026 | 7 | 0 | 0 |
| 26. January 2026 | 7 | 0 | 0 |
| 25. January 2026 | 7 | 1 | 1 |
| 24. January 2026 | 7 | 1 | 0 |
| 23. January 2026 | 6 | 0 | 0 |
| 22. January 2026 | 6 | 2 | 0 |
| 21. January 2026 | 4 | 0 | 0 |
| 20. January 2026 | 4 | 0 | 0 |
| 19. January 2026 | 4 | 0 | 0 |
| 18. January 2026 | 4 | 0 | 0 |
Statistics on currently available clinics for rent in Silkeborg
In the table below, you see a series of data about available clinics to rent in Silkeborg.Also see gathered statistics of all available clinics in Silkeborg over time, the gathered statistics of new clinics in Silkeborg over time, the gathered statistics of rented clinics in Silkeborg over time
| Clinics | |
|---|---|
| Available premises | 13 |
| New premises since yesterday | 1 |
| Rented out premises since yesterday | 0 |
| Total available m2 | 294 |
| Average price per m2 per year without expenses | 279 |
| Highest price per m2 per year | 402 |
| Lowest price per m2 per year | 174 |