


Office space for rent in Soest
There are 14 available office spacesin Soest right now. Companyspace.com collects office spaces from many different parts of the market, so that you as a company can more easily get an overview of available office spacesin Soest.
Companyspace.com today:
Updated 24h 710
Latest update 5 h ago
Active ads 369,199
14 office spaces found
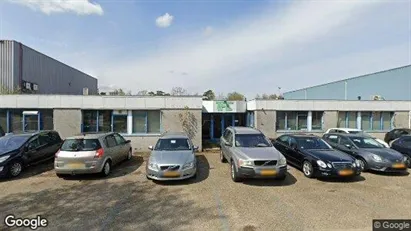
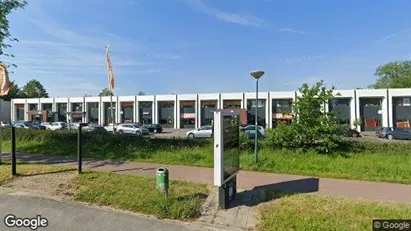
Office space in Soest, Province of Utrecht
 More info
Office space in Soest, Province of Utrecht
Office space for rent in Soest, Province of Utrecht
Areal
Ca. 45 m2
Pris pr. md.
Ca. 1,050 EUR pr md
Område
Soest, Province of Utrecht
Type
Office space
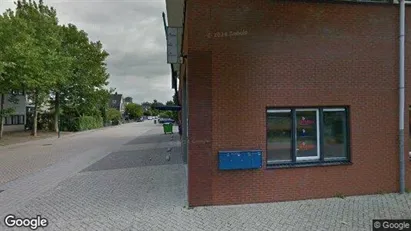
Office space in Soest, Province of Utrecht
 More info
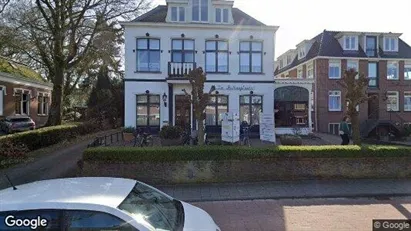
Office space in Soest, Province of Utrecht
Office space for rent in Soest, Province of Utrecht
Areal
Ca. 120 m2
Pris pr. md.
Ca. 850 EUR pr md
Område
Soest, Province of Utrecht
Type
Office space
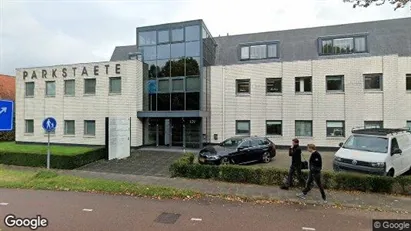
Office space in Soest, Province of Utrecht
 More info
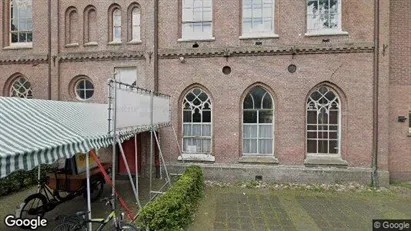
Office space in Soest, Province of Utrecht
Office space for rent in Soest, Province of Utrecht
Areal
Ca. 55 m2
Pris pr. md.
Ca. 1,050 EUR pr md
Område
Soest, Province of Utrecht
Type
Office space
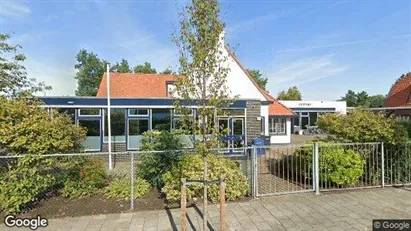
Office space in Soest, Province of Utrecht
 More info
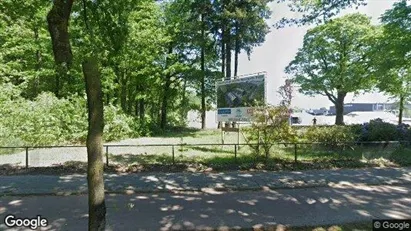
Office space in Soest, Province of Utrecht
Office space for rent in Soest, Province of Utrecht
Areal
Ca. 360 m2
Pris pr. md.
Ca. 2,500 EUR pr md
Område
Soest, Province of Utrecht
Type
Office space
Office space in Soest, Province of Utrecht
 More info
Office space in Soest, Province of Utrecht
Office space for rent in Soest, Province of Utrecht
Areal
Ca. 105 m2
Pris pr. md.
Ca. 1,150 EUR pr md
Område
Soest, Province of Utrecht
Type
Office space
Office space in Soest, Province of Utrecht
 More info
Office space in Soest, Province of Utrecht
Office space for rent in Soest, Province of Utrecht
Areal
Ca. 70 m2
Pris pr. md.
Ca. 700 EUR pr md
Område
Soest, Province of Utrecht
Type
Office space
Office space in Soest, Province of Utrecht
 More info
Office space in Soest, Province of Utrecht
Office space for rent in Soest, Province of Utrecht
Areal
Ca. 120 m2
Pris pr. md.
Ca. 1,250 EUR pr md
Område
Soest, Province of Utrecht
Type
Office space
Office space in Soest, Province of Utrecht
 More info
Office space in Soest, Province of Utrecht
Office space for rent in Soest, Province of Utrecht
Areal
Ca. 65 m2
Pris pr. md.
Ca. 700 EUR pr md
Område
Soest, Province of Utrecht
Type
Office space
Office space in Soest, Province of Utrecht
 More info
Office space in Soest, Province of Utrecht
Office space for rent in Soest, Province of Utrecht
Areal
Ca. 235 m2
Pris pr. md.
Ca. 3,500 EUR pr md
Område
Soest, Province of Utrecht
Type
Office space
Office space in Soest, Province of Utrecht
More info
We monitor the market!
Office space in Soest, Province of Utrecht
Office space for rent in Soest, Province of Utrecht
Areal
Ca. 315 m2
Pris pr. md.
Not stated
Område
Soest, Province of Utrecht
Type
Office space
Office space in Soest, Province of Utrecht
More info
We monitor the market!
Office space in Soest, Province of Utrecht
Office space for rent in Soest, Province of Utrecht
Areal
Ca. 65 m2
Pris pr. md.
Ca. 750 EUR pr md
Område
Soest, Province of Utrecht
Type
Office space
Office space in Soest, Province of Utrecht
More info
We monitor the market!
Office space in Soest, Province of Utrecht
Office space for rent in Soest, Province of Utrecht
Areal
-
Pris pr. md.
Not stated
Område
Soest, Province of Utrecht
Type
Office space
Office space in Soest, Province of Utrecht
More info
We monitor the market!
Office space in Soest, Province of Utrecht
Office space for rent in Soest, Province of Utrecht
Areal
-
Pris pr. md.
Not stated
Område
Soest, Province of Utrecht
Type
Office space
Office space in Soest, Province of Utrecht
More info
We monitor the market!
Office space in Soest, Province of Utrecht
Office space for rent in Soest, Province of Utrecht
Areal
-
Pris pr. md.
Not stated
Område
Soest, Province of Utrecht
Type
Office space
Selected customers
30,000 customers use Companyspace.com
30,000 customers
285,000 companies in our database
2,400 rentals annually
Companyspace.com is used by thousands of landlords, property companies, commercial real estate agents, investors and business centres seeking greater visibility, more enquiries and lower vacancy rates.


