


Commercial property for rent in Vlieland
These commercial premises are closest to your search
We currently have no available commercial premises registered that match your search exactly. Therefore, we show below the commercial premises that best match your search based on the current market.
The shown listings may differ from your original search in terms of, for example, premises type, location, size or price, but they have been selected because they may be relevant alternatives for your business.
Take a look at the suggestions below – or start your search again here.
Companyspace.com today:
New today 608
Updated 24h 691
Notifications about new companyspaces2,243
Copenhagen +1
Stockholm +1
Amsterdam +15
Berlin +4
Oslo +1
Brussels +2
Vienna +37
Dublin (county) +3
Warsaw +15
Roma (region) +1
Latest update 11 min ago
Active ads 371,919
Office space in Smallingerland, Friesland NL
 More info
Office space in Smallingerland, Friesland NL
Op een van de oudste en meest karakteristieke straten van Drachten bieden wij deze representatieve kantoorruimte te huur aan. Het object is gelegen aan de St...
Areal
Ca. 60 m2
Pris pr. md.
Ca. 600 EUR pr md
Område
Smallingerland, Friesland NL
Type
Office space
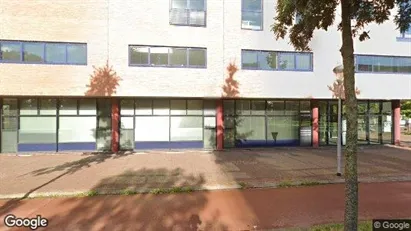
Office space in Leeuwarden, Friesland NL
 More info
Office space in Leeuwarden, Friesland NL
Office space for rent in Leeuwarden, Friesland NL
Areal
Ca. 270 m2
Pris pr. md.
Ca. 2,700 EUR pr md
Område
Leeuwarden, Friesland NL
Type
Office space
Office space in Heerenveen, Friesland NL
 More info
Office space in Heerenveen, Friesland NL
ALGEMEEN
Dit kantoorgebouw is gelegen aan de westkant van het Abe Lenstra Stadion. Vanaf de snelweg A32 is het kantoorgebouw via de afritten Heerenveen Ce...
Areal
24 - 36 m2
Pris pr. md.
Ca. 8,350 EUR pr md
Område
Heerenveen, Friesland NL
Type
Office space
Commercial space in Leeuwarden, Friesland NL
 More info
Commercial space in Leeuwarden, Friesland NL
Commercial space for rent in Leeuwarden, Friesland NL
Areal
1,250 - 1,500 m2
Pris pr. md.
Ca. 6,650 EUR pr md
Område
Leeuwarden, Friesland NL
Type
Commercial property
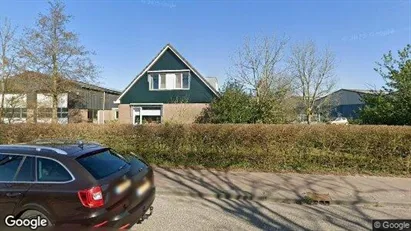
Office space in Ooststellingwerf, Friesland NL
 More info
Office space in Ooststellingwerf, Friesland NL
Office space for rent in Ooststellingwerf, Friesland NL
Areal
Ca. 260 m2
Pris pr. md.
Ca. 300 EUR pr md
Område
Ooststellingwerf, Friesland NL
Type
Office space
Commercial property in Littenseradiel, Friesland NL
 More info
Commercial property in Littenseradiel, Friesland NL
Commercial property for sale in Littenseradiel, Friesland NL
Areal
1,303 - 1,359 m2
Pris
Ca. 1,200,000EUR
Område
Littenseradiel, Friesland NL
Type
Commercial property
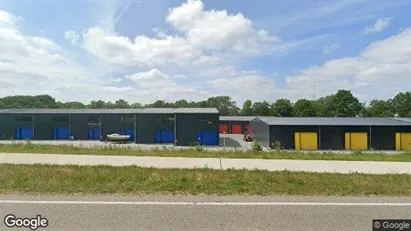
Commercial space in Leeuwarden, Friesland NL
 More info
Commercial space in Leeuwarden, Friesland NL
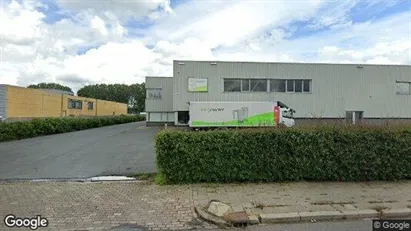
TE HUUR BEDRIJFSRUIMTE VANAF 493 m²
Op zichtlocatie aan de westelijke invalsweg van Leeuwarden zijn deze twee bedrijfsruimtes gelegen.
LOCATIE
Het b...
Areal
493 - 764 m2
Pris pr. md.
Ca. 8,350 EUR pr md
Område
Leeuwarden, Friesland NL
Type
Commercial property
Office space in Heerenveen, Friesland NL
 More info
Office space in Heerenveen, Friesland NL
Office space for rent in Heerenveen, Friesland NL
Areal
-
Pris pr. md.
Ca. 1,600 EUR pr md
Område
Heerenveen, Friesland NL
Type
Office space
Office space in De Fryske Marren, Friesland NL
 More info
Office space in De Fryske Marren, Friesland NL
Office space for rent in De Fryske Marren, Friesland NL
Areal
Ca. 85 m2
Pris pr. md.
Ca. 950 EUR pr md
Område
De Fryske Marren, Friesland NL
Type
Office space
Office space in Leeuwarden, Friesland NL
 More info
Office space in Leeuwarden, Friesland NL
Office space for rent in Leeuwarden, Friesland NL
Areal
Ca. 230 m2
Pris pr. md.
Ca. 500 EUR pr md
Område
Leeuwarden, Friesland NL
Type
Office space
Office property in Leeuwarden, Friesland NL
 More info
Office property in Leeuwarden, Friesland NL
Office space for sale in Leeuwarden, Friesland NL
Areal
-
Pris
Ca. 499,000EUR
Område
Leeuwarden, Friesland NL
Type
Office space
Office space in Leeuwarden, Friesland NL
 More info
Office space in Leeuwarden, Friesland NL
Office space for rent in Leeuwarden, Friesland NL
Areal
Ca. 130 m2
Pris pr. md.
Ca. 600 EUR pr md
Område
Leeuwarden, Friesland NL
Type
Office space
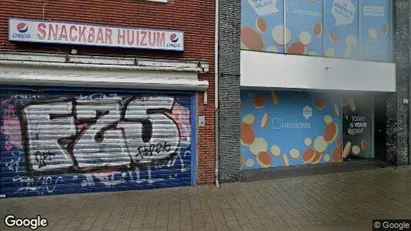
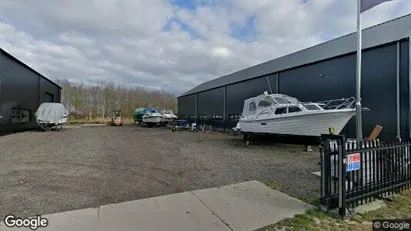
Commercial space in Leeuwarden, Friesland NL
 More info
Commercial space in Leeuwarden, Friesland NL
Op deze toplocatie op de Dobbe 17 te Grou,
op bedrijventerrein Frisia aan het water, komt in deze recent gebouwde (2024) bedrijfshal per 1 juli een bedrij...
Areal
Ca. 60 m2
Pris pr. md.
Ca. 8,350 EUR pr md
Område
Leeuwarden, Friesland NL
Type
Commercial property
Commercial space in De Fryske Marren, Friesland NL
 More info
Commercial space in De Fryske Marren, Friesland NL
Commercial space for rent in De Fryske Marren, Friesland NL
Areal
Ca. 35 m2
Pris pr. md.
Ca. 400 EUR pr md
Område
De Fryske Marren, Friesland NL
Type
Commercial property
Commercial property in Heerenveen, Friesland NL
 More info
Commercial property in Heerenveen, Friesland NL
Commercial property for sale in Heerenveen, Friesland NL
Areal
-
Pris
Ca. 165,000EUR
Område
Heerenveen, Friesland NL
Type
Commercial property
Commercial property in Leeuwarden, Friesland NL
 More info
Commercial property in Leeuwarden, Friesland NL
Commercial property for sale in Leeuwarden, Friesland NL
Areal
-
Pris
Ca. 1,250,000EUR
Område
Leeuwarden, Friesland NL
Type
Commercial property
Office space in Leeuwarden, Friesland NL
 More info
Office space in Leeuwarden, Friesland NL
Office space for rent in Leeuwarden, Friesland NL
Areal
Ca. 400 m2
Pris pr. md.
Not stated
Område
Leeuwarden, Friesland NL
Type
Office space
Office space in Leeuwarden, Friesland NL
 More info
Office space in Leeuwarden, Friesland NL
Office space for rent in Leeuwarden, Friesland NL
Areal
Ca. 150 m2
Pris pr. md.
Ca. 2,000 EUR pr md
Område
Leeuwarden, Friesland NL
Type
Office space
Selected customers
30,000 customers use Companyspace.com
30,000 customers
285,000 companies in our database
2,400 rentals annually
Companyspace.com is used by thousands of landlords, property companies, commercial real estate agents, investors and business centres seeking greater visibility, more enquiries and lower vacancy rates.


