


Clinic for rent in Rheden
These commercial premises are closest to your search
We currently have no available commercial premises registered that match your search exactly. Therefore, we show below the commercial premises that best match your search based on the current market.
The shown listings may differ from your original search in terms of, for example, premises type, location, size or price, but they have been selected because they may be relevant alternatives for your business.
Take a look at the suggestions below – or start your search again here.
Companyspace.com today:
New today 2,759
Updated 24h 2,761
Notifications about new companyspaces2,241
Copenhagen +11
Stockholm +4
Berlin +19
Oslo +2
Brussels +30
Vienna +41
Madrid +1
Dublin (county) +20
Warsaw +1
Latest update 15 min ago
Active ads 320,826
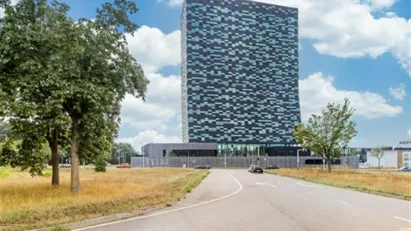
Office space in Nijmegen, Gelderland
 More info
Office space in Nijmegen, Gelderland
Het kantoor is gevestigd op de 17e verdieping van bedrijvenverzamelgebouw FiftyTwo. In de avond is dit gebouw een imposante verschijning, doordat de lichten ...
Areal
Ca. 15 m2
Pris pr. md.
Ca. 100 EUR pr md
Område
Nijmegen, Gelderland
Type
Office space
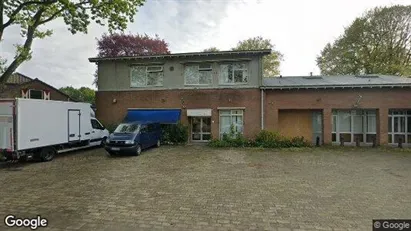
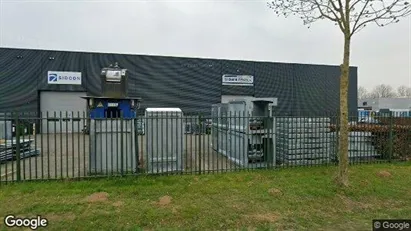
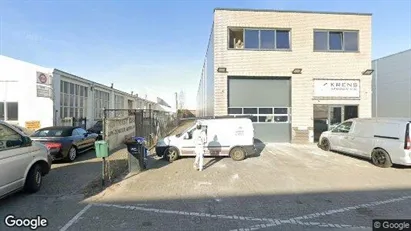
Commercial space in Wijchen, Gelderland
 More info
Commercial space in Wijchen, Gelderland
Totale opp. 300m2.
Magazijn / werkplaats 120m2 met grote elektrische roldeur.
3 kantoren 32m2, 38m2, 40m2
server / opslag 32m2
kantine 22m2
6 eigen par...
Areal
Ca. 300 m2
Pris pr. md.
Ca. 1,500 EUR pr md
Område
Wijchen, Gelderland
Type
Commercial property
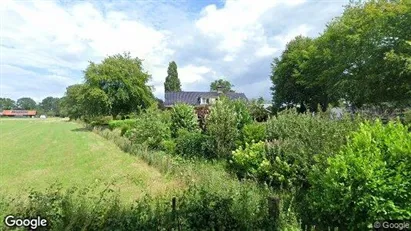
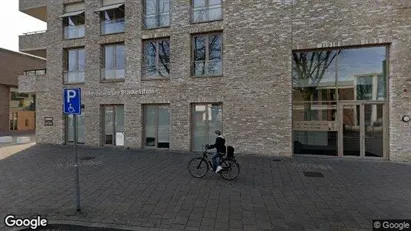
Commercial space in Ede, Gelderland
 More info
Commercial space in Ede, Gelderland
Wij bieden per direct diverse kantoorruimtes aan de Noordelijke Spoorstraat 15 in Ede. De beschikbare ruimtes variëren in grootte van 8 m² tot 65 m², waardoo...
Areal
Ca. 65 m2
Pris pr. md.
Not stated
Område
Ede, Gelderland
Type
Commercial property
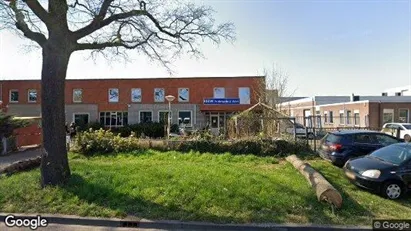
Industrial property in Putten, Gelderland
 More info
Industrial property in Putten, Gelderland
Industrial property for rent in Putten, Gelderland
Areal
Ca. 480 m2
Pris pr. md.
Not stated
Område
Putten, Gelderland
Type
Industrial property
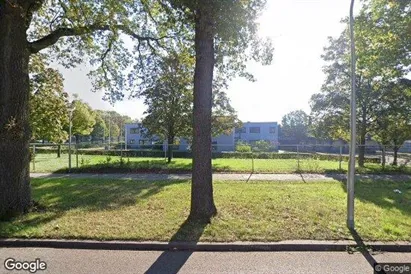
Clinic in Nijmegen, Gelderland
 More info
Clinic in Nijmegen, Gelderland
Te huur in Nijmegen:
Moderne en Complete Fysiotherapieruimte & Gym binnen Gezondheids- en Sportcentrum
Ben jij fysiotherapeut of medisch specialist en ...
Areal
Ca. 300 m2
Pris pr. md.
Not stated
Område
Nijmegen, Gelderland
Type
Clinic
Commercial space in Nijmegen, Gelderland
 More info
Commercial space in Nijmegen, Gelderland
Commercial space for rent in Nijmegen, Gelderland
Areal
Ca. 2,000 m2
Pris pr. md.
Not stated
Område
Nijmegen, Gelderland
Type
Commercial property
Commercial space in Wijchen, Gelderland
 More info
Commercial space in Wijchen, Gelderland
Commercial space for rent in Wijchen, Gelderland
Areal
Ca. 115 m2
Pris pr. md.
Ca. 1,600 EUR pr md
Område
Wijchen, Gelderland
Type
Commercial property
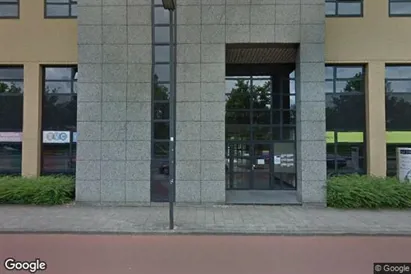
Office space in Nijmegen, Gelderland
 More info
Office space in Nijmegen, Gelderland
Office space for rent in Nijmegen, Gelderland
Areal
Ca. 155 m2
Pris pr. md.
Ca. 1,250 EUR pr md
Område
Nijmegen, Gelderland
Type
Office space
Commercial space in Nijmegen, Gelderland
 More info
Commercial space in Nijmegen, Gelderland
Commercial space for rent in Nijmegen, Gelderland
Areal
Ca. 250 m2
Pris pr. md.
Ca. 3,150 EUR pr md
Område
Nijmegen, Gelderland
Type
Commercial property
Office space in Nijmegen, Gelderland
 More info
Office space in Nijmegen, Gelderland
Office space for rent in Nijmegen, Gelderland
Areal
Ca. 10 m2
Pris pr. md.
Ca. 250 EUR pr md
Område
Nijmegen, Gelderland
Type
Office space
Office space in Nijmegen, Gelderland
 More info
Office space in Nijmegen, Gelderland
Office space for rent in Nijmegen, Gelderland
Areal
Ca. 285 m2
Pris pr. md.
Not stated
Område
Nijmegen, Gelderland
Type
Office space
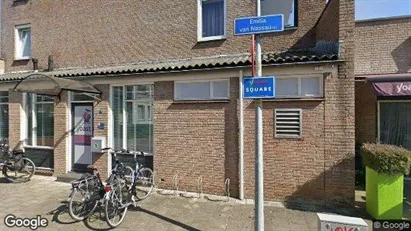
Commercial space in Beuningen, Gelderland
 More info
Commercial space in Beuningen, Gelderland
Commercial space for rent in Beuningen, Gelderland
Areal
Ca. 120 m2
Pris pr. md.
Ca. 850 EUR pr md
Område
Beuningen, Gelderland
Type
Commercial property
Office space in Wijchen, Gelderland
 More info
Office space in Wijchen, Gelderland
Office space for rent in Wijchen, Gelderland
Areal
Ca. 285 m2
Pris pr. md.
Ca. 4,400 EUR pr md
Område
Wijchen, Gelderland
Type
Office space
Commercial space in Wijchen, Gelderland
 More info
Commercial space in Wijchen, Gelderland
Commercial space for rent in Wijchen, Gelderland
Areal
Ca. 160 m2
Pris pr. md.
Ca. 1,250 EUR pr md
Område
Wijchen, Gelderland
Type
Commercial property
Commercial space in Nijmegen, Gelderland
 More info
Commercial space in Nijmegen, Gelderland
Commercial space for rent in Nijmegen, Gelderland
Areal
Ca. 11,380 m2
Pris pr. md.
Not stated
Område
Nijmegen, Gelderland
Type
Commercial property
Office space in Nijmegen, Gelderland
 More info
Office space in Nijmegen, Gelderland
Office space for rent in Nijmegen, Gelderland
Areal
Ca. 75 m2
Pris pr. md.
Ca. 1,800 EUR pr md
Område
Nijmegen, Gelderland
Type
Office space
Office space in Nijmegen, Gelderland
 More info
Office space in Nijmegen, Gelderland
Office space for rent in Nijmegen, Gelderland
Areal
Ca. 350 m2
Pris pr. md.
Not stated
Område
Nijmegen, Gelderland
Type
Office space
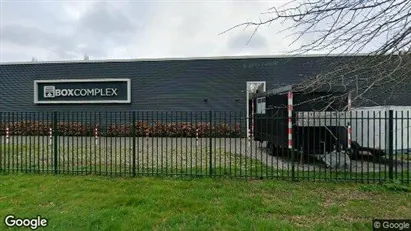
Commercial space in Tiel, Gelderland
 More info
Commercial space in Tiel, Gelderland
Boxcomplex Tiel is met twee complexen gunstig gelegen op bedrijventerrein Latenstein. Voor beide complexen is de bereikbaarheid uitstekend, de locaties zijn ...
Areal
Ca. 20 m2
Pris pr. md.
Ca. 8,350 EUR pr md
Område
Tiel, Gelderland
Type
Commercial property
Selected customers
30,000 customers use Companyspace.com
30,000 customers
285,000 companies in our database
2,400 rentals annually
Companyspace.com is used by thousands of landlords, property companies, commercial real estate agents, investors and business centres seeking greater visibility, more enquiries and lower vacancy rates.


