


Commercial premises for rent in Nijmegen
There are 162 available commercial properties in Nijmegen right now. Companyspace.com collects commercial properties from many different parts of the market, so that you as a company can more easily get an overview of available commercial properties in Nijmegen.
Companyspace.com today:
New today 735
Updated 24h 1,317
Notifications about new companyspaces1,911
Copenhagen +2
Stockholm +1
Vienna +19
Paris +6
Madrid +13
Dublin (county) +54
Warsaw +4
Greater London +8
Latest update 57 min ago
Active ads 361,692
162 company spaces found
Office space in Nijmegen, Gelderland
 More info
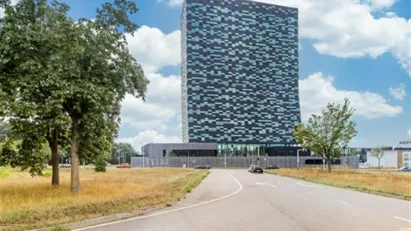
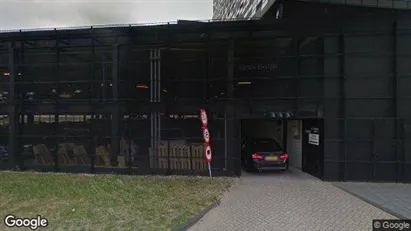
Office space in Nijmegen, Gelderland
Het kantoor is gevestigd op de 17e verdieping van bedrijvenverzamelgebouw FiftyTwo. In de avond is dit gebouw een imposante verschijning, doordat de lichten ...
Areal
Ca. 15 m2
Pris pr. md.
Ca. 100 EUR pr md
Område
Nijmegen, Gelderland
Type
Office space
Clinic in Nijmegen, Gelderland
 More info
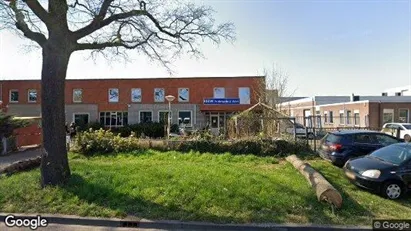
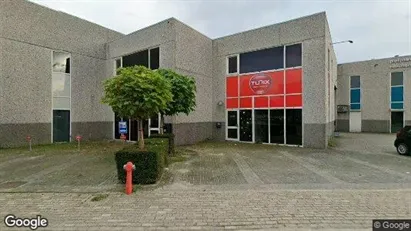
Clinic in Nijmegen, Gelderland
Te huur in Nijmegen:
Moderne en Complete Fysiotherapieruimte & Gym binnen Gezondheids- en Sportcentrum
Ben jij fysiotherapeut of medisch specialist en ...
Areal
Ca. 300 m2
Pris pr. md.
Not stated
Område
Nijmegen, Gelderland
Type
Clinic
Office space in Nijmegen, Gelderland
 More info
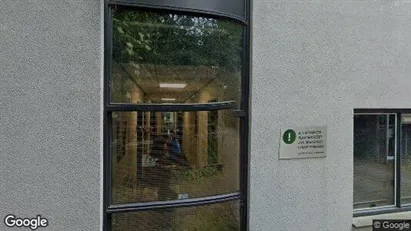
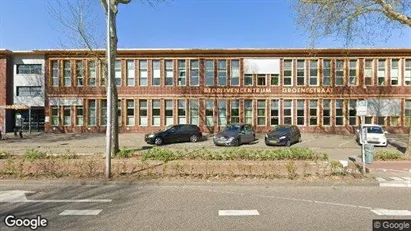
Office space in Nijmegen, Gelderland
Office space for rent in Nijmegen, Gelderland
Areal
Ca. 65 m2
Pris pr. md.
Ca. 950 EUR pr md
Område
Nijmegen, Gelderland
Type
Office space
Commercial space in Nijmegen, Gelderland
 More info
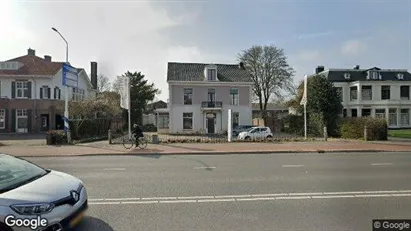
Commercial space in Nijmegen, Gelderland
Commercial space for rent in Nijmegen, Gelderland
Areal
Ca. 11,380 m2
Pris pr. md.
Not stated
Område
Nijmegen, Gelderland
Type
Commercial property
Office space in Nijmegen, Gelderland
 More info
Office space in Nijmegen, Gelderland
Office space for rent in Nijmegen, Gelderland
Areal
Ca. 75 m2
Pris pr. md.
Ca. 1,800 EUR pr md
Område
Nijmegen, Gelderland
Type
Office space
Office space in Nijmegen, Gelderland
 More info
Office space in Nijmegen, Gelderland
Office space for rent in Nijmegen, Gelderland
Areal
Ca. 350 m2
Pris pr. md.
Not stated
Område
Nijmegen, Gelderland
Type
Office space
Office space in Nijmegen, Gelderland
 More info
Office space in Nijmegen, Gelderland
Office space for rent in Nijmegen, Gelderland
Areal
Ca. 15 m2
Pris pr. md.
Ca. 1,000 EUR pr md
Område
Nijmegen, Gelderland
Type
Office space
Office space in Nijmegen, Gelderland
 More info
Office space in Nijmegen, Gelderland
Office space for rent in Nijmegen, Gelderland
Areal
Ca. 350 m2
Pris pr. md.
Not stated
Område
Nijmegen, Gelderland
Type
Office space
Commercial space in Nijmegen, Gelderland
 More info
Commercial space in Nijmegen, Gelderland
Commercial space for rent in Nijmegen, Gelderland
Areal
Ca. 875 m2
Pris pr. md.
Ca. 3,950 EUR pr md
Område
Nijmegen, Gelderland
Type
Commercial property
Commercial space in Nijmegen, Gelderland
 More info
Commercial space in Nijmegen, Gelderland
Commercial space for rent in Nijmegen, Gelderland
Areal
Ca. 175 m2
Pris pr. md.
Ca. 1,150 EUR pr md
Område
Nijmegen, Gelderland
Type
Commercial property
Office space in Nijmegen, Gelderland
 More info
Office space in Nijmegen, Gelderland
Office space for rent in Nijmegen, Gelderland
Areal
-
Pris pr. md.
Not stated
Område
Nijmegen, Gelderland
Type
Office space
Office space in Nijmegen, Gelderland
 More info
Office space in Nijmegen, Gelderland
Office space for rent in Nijmegen, Gelderland
Areal
Ca. 50 m2
Pris pr. md.
Ca. 950 EUR pr md
Område
Nijmegen, Gelderland
Type
Office space
Office space in Nijmegen, Gelderland
 More info
Office space in Nijmegen, Gelderland
Office space for rent in Nijmegen, Gelderland
Areal
Ca. 385 m2
Pris pr. md.
Ca. 3,950 EUR pr md
Område
Nijmegen, Gelderland
Type
Office space
Office space in Nijmegen, Gelderland
 More info
Office space in Nijmegen, Gelderland
Office space for rent in Nijmegen, Gelderland
Areal
Ca. 40 m2
Pris pr. md.
Ca. 700 EUR pr md
Område
Nijmegen, Gelderland
Type
Office space
Office space in Nijmegen, Gelderland
 More info
Office space in Nijmegen, Gelderland
Office space for rent in Nijmegen, Gelderland
Areal
Ca. 120 m2
Pris pr. md.
Ca. 5,400 EUR pr md
Område
Nijmegen, Gelderland
Type
Office space
Office space in Nijmegen, Gelderland
 More info
Office space in Nijmegen, Gelderland
Office space for rent in Nijmegen, Gelderland
Areal
Ca. 60 m2
Pris pr. md.
Ca. 1,700 EUR pr md
Område
Nijmegen, Gelderland
Type
Office space
Commercial space in Nijmegen, Gelderland
 More info
Commercial space in Nijmegen, Gelderland
Commercial space for rent in Nijmegen, Gelderland
Areal
Ca. 480 m2
Pris pr. md.
Ca. 3,650 EUR pr md
Område
Nijmegen, Gelderland
Type
Commercial property
Office space in Nijmegen, Gelderland
 More info
Office space in Nijmegen, Gelderland
Office space for rent in Nijmegen, Gelderland
Areal
Ca. 110 m2
Pris pr. md.
Ca. 3,700 EUR pr md
Område
Nijmegen, Gelderland
Type
Office space
Selected customers
30,000 customers use Companyspace.com
30,000 customers
285,000 companies in our database
2,400 rentals annually
Companyspace.com is used by thousands of landlords, property companies, commercial real estate agents, investors and business centres seeking greater visibility, more enquiries and lower vacancy rates.


