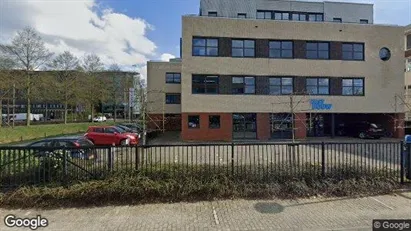
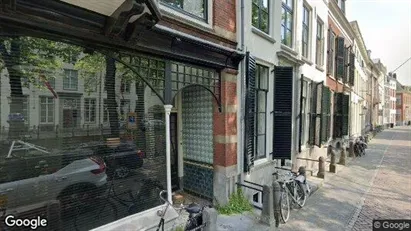
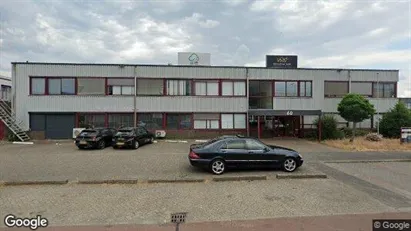
Available office spaces in Province of Utrecht
See all available office spaces in Province of Utrecht below. If you are looking for office space in Province of Utrecht, you have come to the right place. We have most available office spaces in Province of Utrecht in our database. Find office space in Province of Utrecht here. Enjoy.
701 office spaces found
-
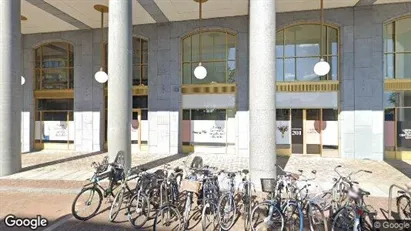
120 m2 office space for rent in Utrecht Leidsche Rijn, Utrecht
- 3,908 EUR per month
- 390.80 EUR /m2/year
-
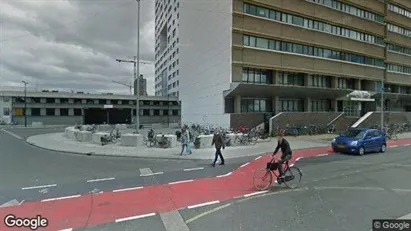
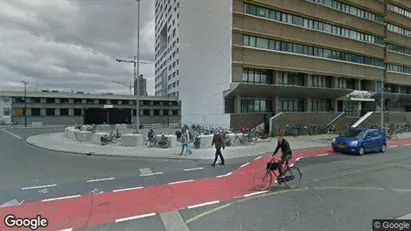
110 m2 office space for rent in Utrecht Zuid-West, Utrecht
- 4,939 EUR per month
- 538.80 EUR /m2/year
-
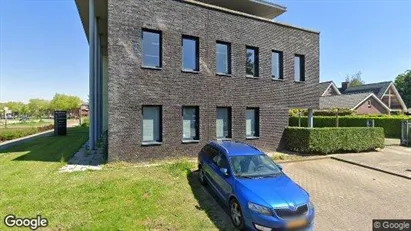
264 m2 office space for rent in Stichtse Vecht, Province of Utrecht
- 3,500 EUR per month
- 159.09 EUR /m2/year
-
10 m2 office space for rent in Utrecht Zuid-West, Utrecht
- 79 EUR per month
- 94.80 EUR /m2/year
-
45 m2 office space for rent in Utrecht Zuid-West, Utrecht
- 2,599 EUR per month
- 693.07 EUR /m2/year
-
120 m2 office space for rent in Utrecht Zuid-West, Utrecht
- 8,399 EUR per month
- 839.90 EUR /m2/year
-
158 m2 office space for rent in Woerden, Province of Utrecht
- 2,312 EUR per month
- 175.63 EUR /m2/year
-
138 m2 office space for rent in Soest, Province of Utrecht
- 1,800 EUR per month
- 156.52 EUR /m2/year
-
90 m2 office space for rent in Utrecht Binnenstad, Utrecht
- 2,250 EUR per month
- 300 EUR /m2/year
-
115 m2 office space for rent in Utrecht West, Utrecht
- 786 EUR per month
- 82 EUR /m2/year
-
39 m2 office space for rent in Utrecht West, Utrecht
- 332 EUR per month
- 102 EUR /m2/year
-
500 m2 office space for rent in Utrecht West, Utrecht
- 272 EUR per month
- 6.53 EUR /m2/year
Frequently asked questions
Statistics on the development of available office spaces for rent in Province of Utrecht over the past month
Also see aggregate statistics on all available office spaces in Province of Utrecht over time, aggregate statistics on new office spaces in Province of Utrecht over time, aggregate statistics on rented office spaces in Province of Utrecht over time
| Date | |||
|---|---|---|---|
| 23. October 2025 | 700 | 49 | 0 |
| 22. October 2025 | 651 | 2 | 0 |
| 21. October 2025 | 649 | 16 | 17 |
| 20. October 2025 | 650 | 13 | 18 |
| 19. October 2025 | 655 | 7 | 6 |
| 18. October 2025 | 654 | 4 | 4 |
| 17. October 2025 | 654 | 19 | 0 |
| 16. October 2025 | 635 | 25 | 5 |
| 15. October 2025 | 615 | 7 | 17 |
| 14. October 2025 | 625 | 0 | 33 |
| 13. October 2025 | 658 | 28 | 16 |
| 12. October 2025 | 646 | 15 | 18 |
| 11. October 2025 | 649 | 7 | 11 |
| 10. October 2025 | 653 | 10 | 11 |
| 9. October 2025 | 654 | 0 | 2 |
| 8. October 2025 | 656 | 17 | 20 |
| 7. October 2025 | 659 | 5 | 9 |
| 6. October 2025 | 663 | 3 | 0 |
| 5. October 2025 | 660 | 21 | 21 |
| 4. October 2025 | 660 | 8 | 7 |
| 3. October 2025 | 659 | 3 | 4 |
| 2. October 2025 | 660 | 4 | 6 |
| 1. October 2025 | 662 | 20 | 28 |
| 30. September 2025 | 670 | 9 | 10 |
| 29. September 2025 | 671 | 5 | 0 |
| 28. September 2025 | 666 | 16 | 16 |
| 27. September 2025 | 666 | 20 | 8 |
| 26. September 2025 | 654 | 17 | 23 |
| 25. September 2025 | 660 | 0 | 7 |
| 24. September 2025 | 667 | 0 | 6 |
| 23. September 2025 | 673 | 1 | 0 |
Statistics on currently available office spaces in Province of Utrecht in The Netherlands
Also see gathered statistics of all available office spaces in Province of Utrecht over time, the gathered statistics of new office spaces in Province of Utrecht over time, the gathered statistics of rented office spaces in Province of Utrecht over time
| Office spaces | |
|---|---|
| Available premises | 701 |
| New premises since yesterday | 49 |
| Rented out premises since yesterday | 0 |
| Total available m2 | 253,727 |
| Average price per m2 per year without expenses | 282 |
| Highest price per m2 per year | 42,352.94 |
| Lowest price per m2 per year | 1.98 |


