


Office spacesin North Brabant
See all available office spaces in North Brabant below. If you are looking for office space in North Brabant, you have come to the right place. We have most available office spaces in North Brabant in our database. Find office space in North Brabant here. Enjoy.
Companyspace.com today:
New today 248
Updated 24h 1,132
Notifications about new companyspaces99
Copenhagen +3
Amsterdam +1
Brussels +2
Vienna +14
Latest update 1 min ago
Active ads 357,588
1,208 office spaces found
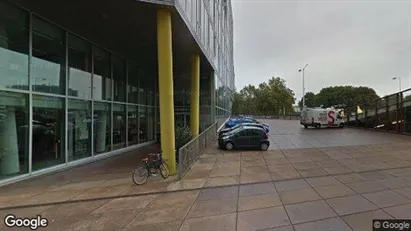
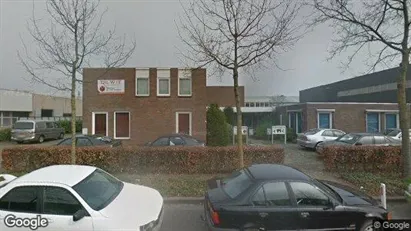
Office space in Geldrop-Mierlo, North Brabant
 More info
Office space in Geldrop-Mierlo, North Brabant
Office space for rent in Geldrop-Mierlo, North Brabant
Areal
Ca. 175 m2
Pris pr. md.
Not stated
Område
Geldrop-Mierlo, North Brabant
Type
Office space
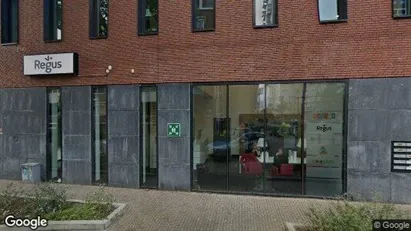
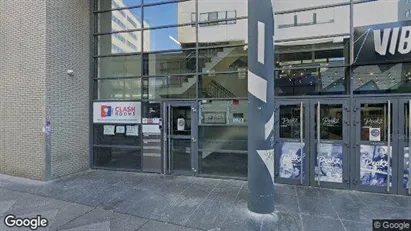
Office space in Den Bosch, North Brabant
 More info
Office space in Den Bosch, North Brabant
Office space for rent in Den Bosch, North Brabant
Areal
Ca. 35 m2
Pris pr. md.
Ca. 600 EUR pr md
Område
Den Bosch, North Brabant
Type
Office space
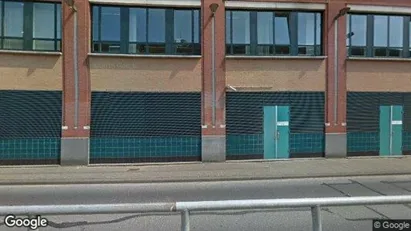
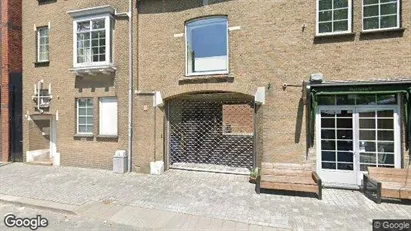
Office space in Veldhoven, North Brabant
 More info
Office space in Veldhoven, North Brabant
Office space for rent in Veldhoven, North Brabant
Areal
Ca. 120 m2
Pris pr. md.
Ca. 750 EUR pr md
Område
Veldhoven, North Brabant
Type
Office space
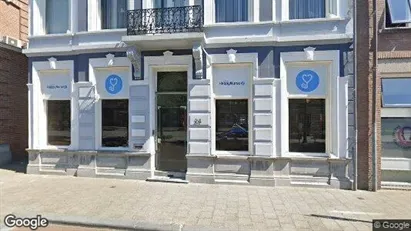
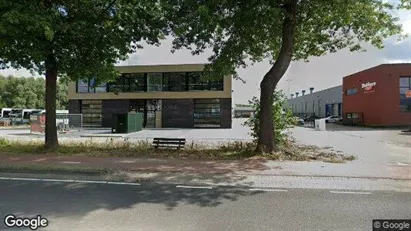
Office space in Eindhoven, North Brabant
 More info
Office space in Eindhoven, North Brabant
Kantoor te huur in Eindhoven, Noord-Brabant
Areal
Ca. 820 m2
Pris pr. md.
Not stated
Område
Eindhoven, North Brabant
Type
Office space
Office space in Tilburg, North Brabant
 More info
Office space in Tilburg, North Brabant
Office space for rent in Tilburg, North Brabant
Areal
Ca. 120 m2
Pris pr. md.
Ca. 4,350 EUR pr md
Område
Tilburg, North Brabant
Type
Office space
Office space in Den Bosch, North Brabant
 More info
Office space in Den Bosch, North Brabant
Office space for rent in Den Bosch, North Brabant
Areal
Ca. 10 m2
Pris pr. md.
Ca. 100 EUR pr md
Område
Den Bosch, North Brabant
Type
Office space
Office space in Den Bosch, North Brabant
 More info
Office space in Den Bosch, North Brabant
Office space for rent in Den Bosch, North Brabant
Areal
Ca. 100 m2
Pris pr. md.
Ca. 1,800 EUR pr md
Område
Den Bosch, North Brabant
Type
Office space
Office space in Breda, North Brabant
 More info
Office space in Breda, North Brabant
Office space for rent in Breda, North Brabant
Areal
Ca. 130 m2
Pris pr. md.
Ca. 2,300 EUR pr md
Område
Breda, North Brabant
Type
Office space
Office space in Meierijstad, North Brabant
 More info
Office space in Meierijstad, North Brabant
Office space for rent in Meierijstad, North Brabant
Areal
Ca. 160 m2
Pris pr. md.
Ca. 1,200 EUR pr md
Område
Meierijstad, North Brabant
Type
Office space
Office space in Eindhoven, North Brabant
 More info
Office space in Eindhoven, North Brabant
Office space for rent in Eindhoven, North Brabant
Areal
Ca. 30 m2
Pris pr. md.
Ca. 750 EUR pr md
Område
Eindhoven, North Brabant
Type
Office space
Office space in Eindhoven, North Brabant
 More info
Office space in Eindhoven, North Brabant
Office space for rent in Eindhoven, North Brabant
Areal
Ca. 695 m2
Pris pr. md.
Not stated
Område
Eindhoven, North Brabant
Type
Office space
Office space in Tilburg, North Brabant
 More info
Office space in Tilburg, North Brabant
Office space for rent in Tilburg, North Brabant
Areal
Ca. 100 m2
Pris pr. md.
Ca. 350 EUR pr md
Område
Tilburg, North Brabant
Type
Office space
Office space in Valkenswaard, North Brabant
 More info
Office space in Valkenswaard, North Brabant
Office space for rent in Valkenswaard, North Brabant
Areal
Ca. 60 m2
Pris pr. md.
Not stated
Område
Valkenswaard, North Brabant
Type
Office space
Office space in Meierijstad, North Brabant
 More info
Office space in Meierijstad, North Brabant
Office space for rent in Meierijstad, North Brabant
Areal
Ca. 105 m2
Pris pr. md.
Ca. 1,150 EUR pr md
Område
Meierijstad, North Brabant
Type
Office space
Office space in Waalre, North Brabant
 More info
Office space in Waalre, North Brabant
Office space for rent in Waalre, North Brabant
Areal
Ca. 30 m2
Pris pr. md.
Not stated
Område
Waalre, North Brabant
Type
Office space
Office space in Veldhoven, North Brabant
 More info
Office space in Veldhoven, North Brabant
Office space for rent in Veldhoven, North Brabant
Areal
Ca. 670 m2
Pris pr. md.
Not stated
Område
Veldhoven, North Brabant
Type
Office space
Office space in Den Bosch, North Brabant
 More info
Office space in Den Bosch, North Brabant
Office space for rent in Den Bosch, North Brabant
Areal
Ca. 870 m2
Pris pr. md.
Not stated
Område
Den Bosch, North Brabant
Type
Office space
Office space in Eindhoven, North Brabant
 More info
Office space in Eindhoven, North Brabant
Office space for rent in Eindhoven, North Brabant
Areal
Ca. 440 m2
Pris pr. md.
Not stated
Område
Eindhoven, North Brabant
Type
Office space
Selected customers
30,000 customers use Companyspace.com
30,000 customers
285,000 companies in our database
2,400 rentals annually
Companyspace.com is used by thousands of landlords, property companies, commercial real estate agents, investors and business centres seeking greater visibility, more enquiries and lower vacancy rates.


