


Industrial property for rent in Curinga
These commercial premises are closest to your search
We currently have no available commercial premises registered that match your search exactly. Therefore, we show below the commercial premises that best match your search based on the current market.
The shown listings may differ from your original search in terms of, for example, premises type, location, size or price, but they have been selected because they may be relevant alternatives for your business.
Take a look at the suggestions below – or start your search again here.
Companyspace.com today:
New today 31
Updated 24h 111
Copenhagen +2
Stockholm +1
Vienna +6
Latest update 53 min ago
Active ads 366,120
Shop in Vibo Valentia, Calabria
 More info
Shop in Vibo Valentia, Calabria
Shop for rent in Vibo Valentia, Calabria
Areal
Ca. 120 m2
Pris pr. md.
Ca. 800 EUR pr md
Område
Vibo Valentia, Calabria
Type
Shop
Commercial space in Vibo Valentia, Calabria
 More info
Commercial space in Vibo Valentia, Calabria
Commercial space for rent in Vibo Valentia, Calabria
Areal
Ca. 100 m2
Pris pr. md.
Ca. 500 EUR pr md
Område
Vibo Valentia, Calabria
Type
Commercial property
Commercial property in Rovito, Calabria
More info
Commercial property in Rovito, Calabria
Commercial property In vendita in Rovito, Calabria
Areal
Ca. 150 m2
Pris
Ca. 95,000EUR
Område
Rovito, Calabria
Type
Commercial property
Shop in Cosenza, Calabria
More info
Shop in Cosenza, Calabria
Negozio In affitto in Cosenza, Calabria
Areal
Ca. 170 m2
Pris pr. md.
Ca. 1,400 EUR pr md
Område
Cosenza, Calabria
Type
Shop
Shop in Amato, Calabria
More info
Shop in Amato, Calabria
Shop for rent in Amato, Calabria
Areal
Ca. 60 m2
Pris pr. md.
Ca. 850 EUR pr md
Område
Amato, Calabria
Type
Shop
Commercial property in Cosenza, Calabria
More info
Commercial property in Cosenza, Calabria
Commercial property In vendita in Cosenza, Calabria
Areal
Ca. 95 m2
Pris
Ca. 129,000EUR
Område
Cosenza, Calabria
Type
Commercial property
Commercial property in Cosenza, Calabria
More info
Commercial property in Cosenza, Calabria
Commercial property In vendita in Cosenza, Calabria
Areal
Ca. 135 m2
Pris
Ca. 165,000EUR
Område
Cosenza, Calabria
Type
Commercial property
Commercial space in Cosenza, Calabria
More info
Commercial space in Cosenza, Calabria
Commercial space for rent in Cosenza, Calabria
Areal
Ca. 85 m2
Pris pr. md.
Ca. 1,700 EUR pr md
Område
Cosenza, Calabria
Type
Commercial property
Shop in Cosenza, Calabria
More info
Shop in Cosenza, Calabria
Shop for rent in Cosenza, Calabria
Areal
Ca. 160 m2
Pris pr. md.
Ca. 1,600 EUR pr md
Område
Cosenza, Calabria
Type
Shop
Commercial space in Rende, Calabria
More info
Commercial space in Rende, Calabria
Commercial space for rent in Rende, Calabria
Areal
Ca. 150 m2
Pris pr. md.
Ca. 150 EUR pr md
Område
Rende, Calabria
Type
Commercial property
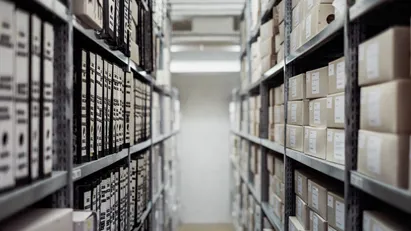
Warehouse in Zumpano, Calabria
 More info
Warehouse in Zumpano, Calabria
Warehouse for rent in Zumpano, Calabria
Areal
Ca. 5 m2
Pris pr. md.
Ca. 3,000 EUR pr md
Område
Zumpano, Calabria
Type
Warehouse
Retail property in Scigliano, Calabria
More info
Retail property in Scigliano, Calabria
Shop for sale in Scigliano, Calabria
Areal
Ca. 35 m2
Pris
Ca. 119,000EUR
Område
Scigliano, Calabria
Type
Shop
Commercial property in Montalto Uffugo, Calabria
More info
Commercial property in Montalto Uffugo, Calabria
Commercial property In vendita in Montalto Uffugo, Calabria
Areal
Ca. 140 m2
Pris
Ca. 265,000EUR
Område
Montalto Uffugo, Calabria
Type
Commercial property
Commercial property in Mendicino, Calabria
More info
Commercial property in Mendicino, Calabria
Commercial property In vendita in Mendicino, Calabria
Areal
Ca. 120 m2
Pris
Ca. 90,000EUR
Område
Mendicino, Calabria
Type
Commercial property
Garage in Cosenza, Calabria
 More info
Garage in Cosenza, Calabria
Garage In affitto in Cosenza, Calabria
Areal
Ca. 25 m2
Pris pr. md.
Ca. 300 EUR pr md
Område
Cosenza, Calabria
Type
Garage
Shop in Cosenza, Calabria
More info
Shop in Cosenza, Calabria
Negozio In affitto in Cosenza, Calabria
Areal
Ca. 100 m2
Pris pr. md.
Ca. 900 EUR pr md
Område
Cosenza, Calabria
Type
Shop
Warehouse in Cosenza, Calabria
More info
Warehouse in Cosenza, Calabria
Magazzino In affitto in Cosenza, Calabria
Areal
Ca. 45 m2
Pris pr. md.
Ca. 300 EUR pr md
Område
Cosenza, Calabria
Type
Warehouse
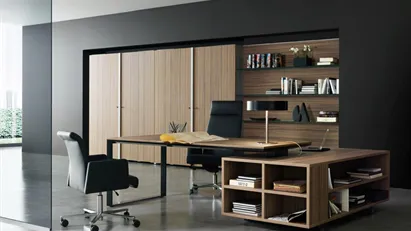
Office space in Gasperina, Calabria
 More info
Office space in Gasperina, Calabria
Office space for rent in Gasperina, Calabria
Areal
Ca. 80 m2
Pris pr. md.
Ca. 850 EUR pr md
Område
Gasperina, Calabria
Type
Office space
Selected customers
30,000 customers use Companyspace.com
30,000 customers
285,000 companies in our database
2,400 rentals annually
Companyspace.com is used by thousands of landlords, property companies, commercial real estate agents, investors and business centres seeking greater visibility, more enquiries and lower vacancy rates.


