


Office spaces in Italy
Companyspace.com today:
New today 138
Updated 24h 662
Notifications about new companyspaces20
Copenhagen +4
Stockholm +1
Dublin (county) +1
Warsaw +3
Latest update 1 min ago
Active ads 364,045
1,911 office spaces found
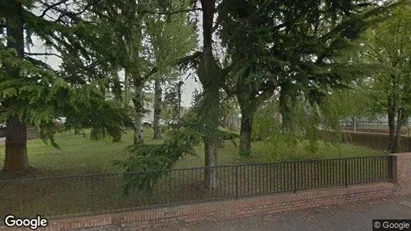
Office property in Paderno Dugnano, Lombardia
 More info
Office property in Paderno Dugnano, Lombardia
Office space for sale in Paderno Dugnano, Lombardia
Areal
Ca. 2,700 m2
Pris
Ca. 2,200,000EUR
Område
Paderno Dugnano, Lombardia
Type
Office space
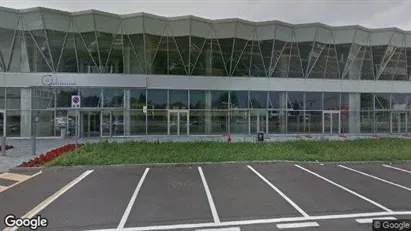
Office space in Paderno Dugnano, Lombardia
 More info
Office space in Paderno Dugnano, Lombardia
Office space for rent in Paderno Dugnano, Lombardia
Areal
Ca. 90 m2
Pris pr. md.
Ca. 1,000 EUR per month
Område
Paderno Dugnano, Lombardia
Type
Office space
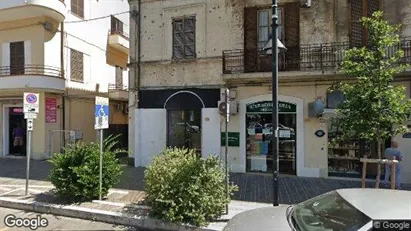
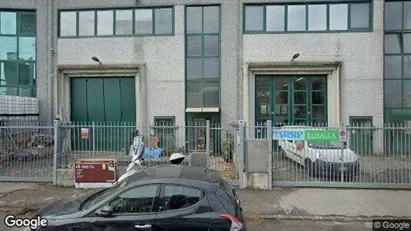
Office property in Pescara, Abruzzo
 More info
Office property in Pescara, Abruzzo
Spazio ufficio In vendita in Pescara, Abruzzo
Areal
-
Pris
Ca. 125,000EUR
Område
Pescara, Abruzzo
Type
Office space
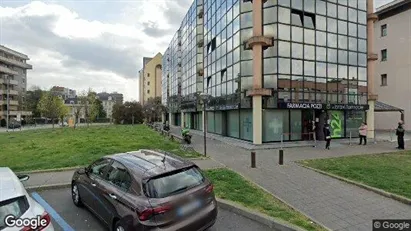
Office space in Sesto San Giovanni, Lombardia
 More info
Office space in Sesto San Giovanni, Lombardia
Office space for rent in Sesto San Giovanni, Lombardia
Areal
Ca. 1,280 m2
Pris pr. md.
Ca. 550 EUR per month
Område
Sesto San Giovanni, Lombardia
Type
Office space
Office property in Roma Municipio IX – EUR, Roma (region)
 More info
Office property in Roma Municipio IX – EUR, Roma (region)
Office space for sale in Roma Municipio IX – EUR, Roma (region)
Areal
Ca. 120 m2
Pris
Ca. 399,000EUR
Område
Roma Municipio IX – EUR, Roma (region)
Type
Office space
Office space in Monza, Lombardia
 More info
Office space in Monza, Lombardia
Spazio ufficio In affitto in Monza, Lombardia
Areal
Ca. 280 m2
Pris pr. md.
Ca. 2,500 EUR per month
Område
Monza, Lombardia
Type
Office space
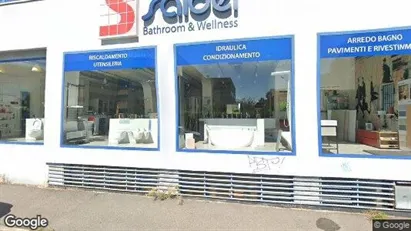
Office property in Pescara, Abruzzo
 More info
Office property in Pescara, Abruzzo
Spazio ufficio In vendita in Pescara, Abruzzo
Areal
-
Pris
Ca. 175,000EUR
Område
Pescara, Abruzzo
Type
Office space
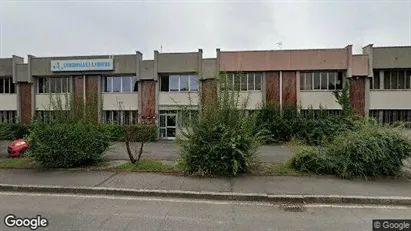
Office property in Cormano, Lombardia
 More info
Office property in Cormano, Lombardia
Office space for sale in Cormano, Lombardia
Areal
Ca. 845 m2
Pris
Ca. 850,000EUR
Område
Cormano, Lombardia
Type
Office space
Office space in Cologno Monzese, Lombardia
 More info
Office space in Cologno Monzese, Lombardia
Office space for rent in Cologno Monzese, Lombardia
Areal
Ca. 1,280 m2
Pris pr. md.
Ca. 550 EUR per month
Område
Cologno Monzese, Lombardia
Type
Office space
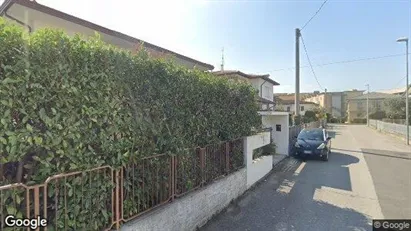
Office property in Noventa Padovana, Veneto
 More info
Office property in Noventa Padovana, Veneto
Office space In vendita in Noventa Padovana, Veneto
Areal
Ca. 215 m2
Pris
Ca. 187,000EUR
Område
Noventa Padovana, Veneto
Type
Office space
Office space in Castel Maggiore, Emilia-Romagna
 More info
Office space in Castel Maggiore, Emilia-Romagna
Office space for rent in Castel Maggiore, Emilia-Romagna
Areal
Ca. 250 m2
Pris pr. md.
Ca. 2,500 EUR per month
Område
Castel Maggiore, Emilia-Romagna
Type
Office space
Office space in Busnago, Lombardia
 More info
Office space in Busnago, Lombardia
Office space for rent in Busnago, Lombardia
Areal
Ca. 220 m2
Pris pr. md.
Ca. 150 EUR per month
Område
Busnago, Lombardia
Type
Office space
Office property in Pescara, Abruzzo
 More info
Office property in Pescara, Abruzzo
Spazio ufficio In vendita in Pescara, Abruzzo
Areal
-
Pris
Ca. 259,000EUR
Område
Pescara, Abruzzo
Type
Office space
Office space in Cernusco sul Naviglio, Lombardia
 More info
Office space in Cernusco sul Naviglio, Lombardia
Office space for rent in Cernusco sul Naviglio, Lombardia
Areal
Ca. 90 m2
Pris pr. md.
Ca. 100 EUR per month
Område
Cernusco sul Naviglio, Lombardia
Type
Office space
Office space in Brugherio, Lombardia
 More info
Office space in Brugherio, Lombardia
Office space for rent in Brugherio, Lombardia
Areal
Ca. 110 m2
Pris pr. md.
Ca. 100 EUR per month
Område
Brugherio, Lombardia
Type
Office space
Office space in Lissone, Lombardia
 More info
Office space in Lissone, Lombardia
Office space for rent in Lissone, Lombardia
Areal
Ca. 250 m2
Pris pr. md.
Ca. 200 EUR per month
Område
Lissone, Lombardia
Type
Office space
Office space in Lissone, Lombardia
 More info
Office space in Lissone, Lombardia
Office space for rent in Lissone, Lombardia
Areal
Ca. 340 m2
Pris pr. md.
Ca. 250 EUR per month
Område
Lissone, Lombardia
Type
Office space
Office space in Firenze, Toscana
 More info
Office space in Firenze, Toscana
Office space for rent in Firenze, Toscana
Areal
Ca. 135 m2
Pris pr. md.
Ca. 1,400 EUR per month
Område
Firenze, Toscana
Type
Office space
Selected customers
Selected customers
30,000 customers use Companyspace.com
30,000 customers
285,000 companies in our database
2,400 rentals annually
Companyspace.com is used by thousands of landlords, property companies, commercial real estate agents, investors and business centres seeking greater visibility, more enquiries and lower vacancy rates.


