


Industrial property for rent in Ireland
There are 639 available industrial properties in Ireland right now. Companyspace.com collects industrial properties from many different parts of the market, so that you as a company can more easily get an overview of available industrial properties in Ireland.
Companyspace.com today:
New today 1,475
Updated 24h 1,674
Notifications about new companyspaces1,923
Copenhagen +6
Stockholm +5
Amsterdam +2
Berlin +2
Brussels +11
Vienna +21
Madrid +2
Dublin (county) +19
Warsaw +8
Roma (region) +2
Lisbon +1
Latest update 1 min ago
Active ads 364,993
639 industrial properties found
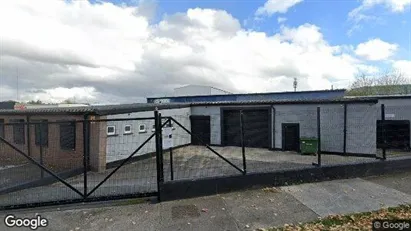
Industrial property in Carrickmacross, Monaghan (region)
 More info
Industrial property in Carrickmacross, Monaghan (region)
Modern 8,432sq ft Warehouse/Agricultural Store available for lease.
Internally, 124ft long and 68ft feet wide. The roof height is 18ft to the eves and 25...
Areal
Ca. 785 m2
Pris pr. md.
Not stated
Område
Carrickmacross, Monaghan (region)
Type
Industrial property
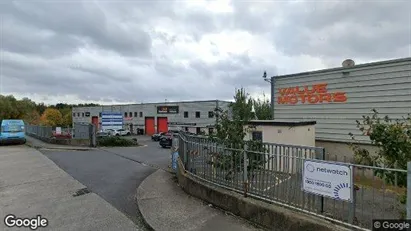
Industrial property in Dublin 11, Dublin
 More info
Industrial property in Dublin 11, Dublin
Industrial property for rent in Dublin 11, Dublin
Areal
Ca. 240 m2
Pris pr. md.
Ca. 2,800 EUR per month
Område
Dublin 11, Dublin
Type
Industrial property
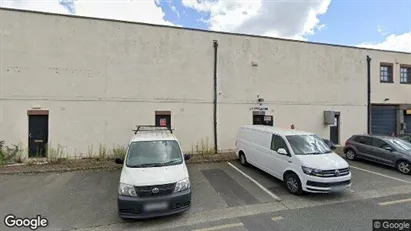
Industrial property in Dublin 11, Dublin
 More info
Industrial property in Dublin 11, Dublin
Industrial property for rent in Dublin 11, Dublin
Areal
Ca. 250 m2
Pris pr. md.
Ca. 3,600 EUR per month
Område
Dublin 11, Dublin
Type
Industrial property
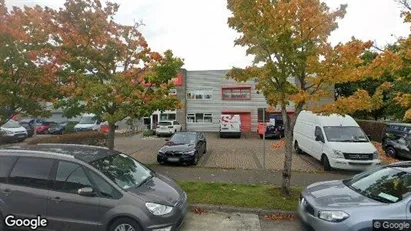
Industrial property in Dublin 9, Dublin
 More info
Industrial property in Dublin 9, Dublin
Industrial property for rent in Dublin 9, Dublin
Areal
Ca. 35 m2
Pris pr. md.
Ca. 600 EUR per month
Område
Dublin 9, Dublin
Type
Industrial property
Industrial property in Dublin 12, Dublin
 More info
Industrial property in Dublin 12, Dublin
Industrial property for rent in Dublin 12, Dublin
Areal
Ca. 140 m2
Pris pr. md.
Ca. 3,000 EUR per month
Område
Dublin 12, Dublin
Type
Industrial property
Industrial property in Dublin 9, Dublin
 More info
Industrial property in Dublin 9, Dublin
Industrial property for rent in Dublin 9, Dublin
Areal
Ca. 305 m2
Pris pr. md.
Ca. 4,350 EUR per month
Område
Dublin 9, Dublin
Type
Industrial property
Industrial property in Dublin 1, Dublin
 More info
Industrial property in Dublin 1, Dublin
Industrial property for rent in Dublin 1, Dublin
Areal
Ca. 60 m2
Pris pr. md.
Ca. 600 EUR per month
Område
Dublin 1, Dublin
Type
Industrial property
Industrial property in Dublin 18, Dublin
 More info
Industrial property in Dublin 18, Dublin
Industrial property for rent in Dublin 18, Dublin
Areal
Ca. 50 m2
Pris pr. md.
Ca. 900 EUR per month
Område
Dublin 18, Dublin
Type
Industrial property
Industrial property in Dublin 24, Dublin
 More info
Industrial property in Dublin 24, Dublin
Industrial property for rent in Dublin 24, Dublin
Areal
Ca. 5 m2
Pris pr. md.
Ca. 17,500 EUR per month
Område
Dublin 24, Dublin
Type
Industrial property
Industrial property in Dublin 4, Dublin
 More info
Industrial property in Dublin 4, Dublin
Industrial property for rent in Dublin 4, Dublin
Areal
Ca. 10 m2
Pris pr. md.
Ca. 400 EUR per month
Område
Dublin 4, Dublin
Type
Industrial property
Industrial property in Dublin 3, Dublin
 More info
Industrial property in Dublin 3, Dublin
Industrial property for rent in Dublin 3, Dublin
Areal
Ca. 385 m2
Pris pr. md.
Ca. 5,150 EUR per month
Område
Dublin 3, Dublin
Type
Industrial property
Industrial property in Dublin 11, Dublin
 More info
Industrial property in Dublin 11, Dublin
Industrial property for rent in Dublin 11, Dublin
Areal
-
Pris pr. md.
Ca. 2,100 EUR per month
Område
Dublin 11, Dublin
Type
Industrial property
Industrial property in Dublin 5, Dublin
 More info
Industrial property in Dublin 5, Dublin
Industrial property for rent in Dublin 5, Dublin
Areal
Ca. 100 m2
Pris pr. md.
Ca. 2,500 EUR per month
Område
Dublin 5, Dublin
Type
Industrial property
Industrial property in Dublin 12, Dublin
 More info
Industrial property in Dublin 12, Dublin
Industrial property for rent in Dublin 12, Dublin
Areal
Ca. 5 m2
Pris pr. md.
Ca. 13,350 EUR per month
Område
Dublin 12, Dublin
Type
Industrial property
Industrial property in Dublin 12, Dublin
 More info
Industrial property in Dublin 12, Dublin
Industrial property for rent in Dublin 12, Dublin
Areal
Ca. 970 m2
Pris pr. md.
Ca. 9,150 EUR per month
Område
Dublin 12, Dublin
Type
Industrial property
Industrial property in Dublin 5, Dublin
 More info
Industrial property in Dublin 5, Dublin
Industrial property for rent in Dublin 5, Dublin
Areal
Ca. 100 m2
Pris pr. md.
Ca. 2,500 EUR per month
Område
Dublin 5, Dublin
Type
Industrial property
Industrial property in Dublin 11, Dublin
 More info
Industrial property in Dublin 11, Dublin
Industrial property for rent in Dublin 11, Dublin
Areal
Ca. 30 m2
Pris pr. md.
Ca. 550 EUR per month
Område
Dublin 11, Dublin
Type
Industrial property
Industrial property in Dublin 3, Dublin
 More info
Industrial property in Dublin 3, Dublin
Industrial property for rent in Dublin 3, Dublin
Areal
Ca. 20 m2
Pris pr. md.
Ca. 950 EUR per month
Område
Dublin 3, Dublin
Type
Industrial property
Selected customers


