


Industrial properties in Tuusula
Companyspace.com today:
New today 2,170
Updated 24h 2,225
Notifications about new companyspaces2,110
Copenhagen +135
Stockholm +7
Amsterdam +15
Berlin +1
Brussels +56
Vienna +6
Dublin (county) +4
Warsaw +8
Latest update 1 min ago
Active ads 368,569
98 industrial properties found
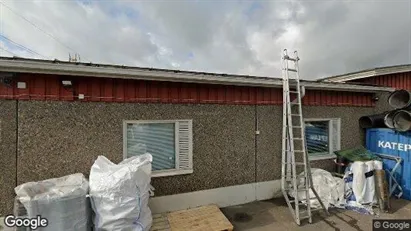
Industrial property in Tuusula, Uusimaa
 More info
Industrial property in Tuusula, Uusimaa
Industrial property for rent in Tuusula, Uusimaa
Areal
Ca. 70 m2
Pris pr. md.
Ca. 1,150 EUR pr md
Område
Tuusula, Uusimaa
Type
Industrial property
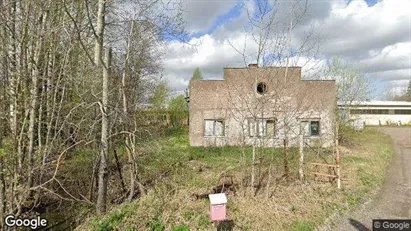
Industrial property in Tuusula, Uusimaa
 More info
Industrial property in Tuusula, Uusimaa
Industrial property for rent in Tuusula, Uusimaa
Areal
Ca. 55 m2
Pris pr. md.
Ca. 600 EUR pr md
Område
Tuusula, Uusimaa
Type
Industrial property
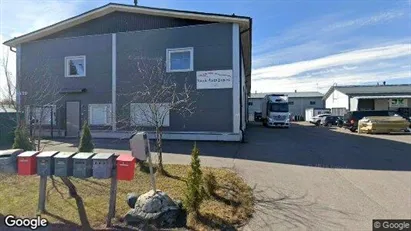
Industrial property in Tuusula, Uusimaa
 More info
Industrial property in Tuusula, Uusimaa
Industrial property for rent in Tuusula, Uusimaa
Areal
Ca. 200 m2
Pris pr. md.
Ca. 1,750 EUR pr md
Område
Tuusula, Uusimaa
Type
Industrial property
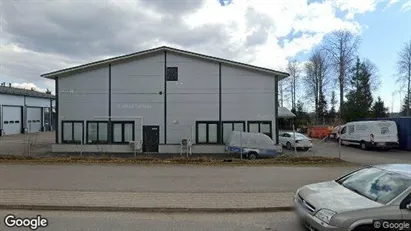
Industrial property in Tuusula, Uusimaa
 More info
Industrial property in Tuusula, Uusimaa
Industrial property for rent in Tuusula, Uusimaa
Areal
Ca. 510 m2
Pris pr. md.
Ca. 3,500 EUR pr md
Område
Tuusula, Uusimaa
Type
Industrial property
Industrial property in Tuusula, Uusimaa
 More info
Industrial property in Tuusula, Uusimaa
Teollisuuskiinteistö Vuokrattavana sisälläTuusula, Uusimaa
Areal
Ca. 90 m2
Pris pr. md.
Ca. 11,600 EUR pr md
Område
Tuusula, Uusimaa
Type
Industrial property
Industrial property in Tuusula, Uusimaa
 More info
Industrial property in Tuusula, Uusimaa
Industrial property for rent in Tuusula, Uusimaa
Areal
Ca. 100 m2
Pris pr. md.
Ca. 1,000 EUR pr md
Område
Tuusula, Uusimaa
Type
Industrial property
Industrial property in Tuusula, Uusimaa
 More info
Industrial property in Tuusula, Uusimaa
Industrial property for rent in Tuusula, Uusimaa
Areal
Ca. 45 m2
Pris pr. md.
Ca. 550 EUR pr md
Område
Tuusula, Uusimaa
Type
Industrial property
Industrial property in Tuusula, Uusimaa
 More info
Industrial property in Tuusula, Uusimaa
Teollisuuskiinteistö Vuokrattavana sisälläTuusula, Uusimaa
Areal
Ca. 45 m2
Pris pr. md.
Ca. 50 EUR pr md
Område
Tuusula, Uusimaa
Type
Industrial property
Industrial property in Tuusula, Uusimaa
 More info
Industrial property in Tuusula, Uusimaa
Industrial property for rent in Tuusula, Uusimaa
Areal
Ca. 55 m2
Pris pr. md.
Ca. 500 EUR pr md
Område
Tuusula, Uusimaa
Type
Industrial property
Industrial property in Tuusula, Uusimaa
More info
We monitor the market!
Industrial property in Tuusula, Uusimaa
Teollisuuskiinteistö Vuokrattavana sisälläTuusula, Uusimaa
Areal
Ca. 50 m2
Pris pr. md.
Ca. 7,100 EUR pr md
Område
Tuusula, Uusimaa
Type
Industrial property
Industrial property in Tuusula, Uusimaa
More info
We monitor the market!
Industrial property in Tuusula, Uusimaa
Teollisuuskiinteistö Vuokrattavana sisälläTuusula, Uusimaa
Areal
Ca. 50 m2
Pris pr. md.
Ca. 50 EUR pr md
Område
Tuusula, Uusimaa
Type
Industrial property
Industrial property in Tuusula, Uusimaa
More info
We monitor the market!
Industrial property in Tuusula, Uusimaa
Industrial property for rent in Tuusula, Uusimaa
Areal
Ca. 90 m2
Pris pr. md.
Ca. 1,100 EUR pr md
Område
Tuusula, Uusimaa
Type
Industrial property
Industrial property in Tuusula, Uusimaa
More info
We monitor the market!
Industrial property in Tuusula, Uusimaa
Industrial property for rent in Tuusula, Uusimaa
Areal
Ca. 970 m2
Pris pr. md.
Ca. 9,700 EUR pr md
Område
Tuusula, Uusimaa
Type
Industrial property
Industrial property in Tuusula, Uusimaa
More info
We monitor the market!
Industrial property in Tuusula, Uusimaa
Industrial property for rent in Tuusula, Uusimaa
Areal
Ca. 230 m2
Pris pr. md.
Ca. 1,750 EUR pr md
Område
Tuusula, Uusimaa
Type
Industrial property
Industrial property in Tuusula, Uusimaa
More info
We monitor the market!
Industrial property in Tuusula, Uusimaa
Industrial property for rent in Tuusula, Uusimaa
Areal
Ca. 230 m2
Pris pr. md.
Ca. 1,600 EUR pr md
Område
Tuusula, Uusimaa
Type
Industrial property
Industrial property in Tuusula, Uusimaa
More info
We monitor the market!
Industrial property in Tuusula, Uusimaa
Teollisuuskiinteistö Vuokrattavana sisälläTuusula, Uusimaa
Areal
Ca. 105 m2
Pris pr. md.
Ca. 16,500 EUR pr md
Område
Tuusula, Uusimaa
Type
Industrial property
Industrial property in Tuusula, Uusimaa
More info
We monitor the market!
Industrial property in Tuusula, Uusimaa
Industrial property for rent in Tuusula, Uusimaa
Areal
Ca. 120 m2
Pris pr. md.
Ca. 1,300 EUR pr md
Område
Tuusula, Uusimaa
Type
Industrial property
Industrial property in Tuusula, Uusimaa
More info
We monitor the market!
Industrial property in Tuusula, Uusimaa
Industrial property for rent in Tuusula, Uusimaa
Areal
Ca. 125 m2
Pris pr. md.
Ca. 1,450 EUR pr md
Område
Tuusula, Uusimaa
Type
Industrial property
Selected customers
30,000 customers use Companyspace.com
30,000 customers
285,000 companies in our database
2,400 rentals annually
Companyspace.com is used by thousands of landlords, property companies, commercial real estate agents, investors and business centres seeking greater visibility, more enquiries and lower vacancy rates.


