


Industrial properties in Pirkkala
Companyspace.com today:
New today 904
Updated 24h 1,184
Notifications about new companyspaces2,292
Copenhagen +3
Amsterdam +17
Berlin +14
Brussels +2
Vienna +14
Dublin (county) +44
Warsaw +47
Latest update 2 h ago
Active ads 360,382
113 industrial properties found
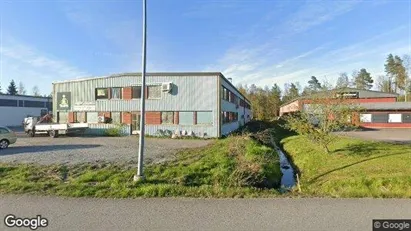
Industrial property in Pirkkala, Pirkanmaa
 More info
Industrial property in Pirkkala, Pirkanmaa
Industrial property for rent in Pirkkala, Pirkanmaa
Areal
Ca. 280 m2
Pris pr. md.
Ca. 2,100 EUR pr md
Område
Pirkkala, Pirkanmaa
Type
Industrial property
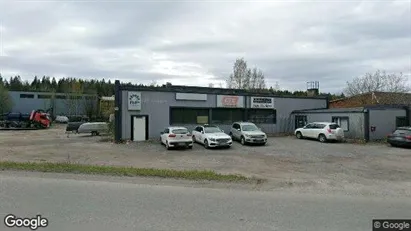
Industrial property in Pirkkala, Pirkanmaa
 More info
Industrial property in Pirkkala, Pirkanmaa
Industrial property for rent in Pirkkala, Pirkanmaa
Areal
Ca. 150 m2
Pris pr. md.
Ca. 1,050 EUR pr md
Område
Pirkkala, Pirkanmaa
Type
Industrial property
Industrial property in Pirkkala, Pirkanmaa
 More info
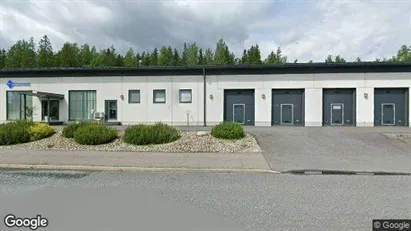
Industrial property in Pirkkala, Pirkanmaa
Industrial property for rent in Pirkkala, Pirkanmaa
Areal
Ca. 200 m2
Pris pr. md.
Ca. 1,500 EUR pr md
Område
Pirkkala, Pirkanmaa
Type
Industrial property
Industrial property in Pirkkala, Pirkanmaa
 More info
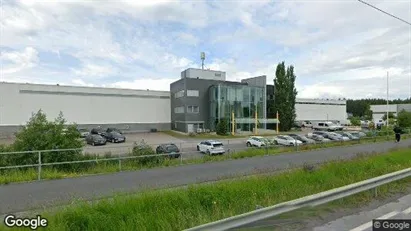
Industrial property in Pirkkala, Pirkanmaa
Industrial property for rent in Pirkkala, Pirkanmaa
Areal
Ca. 30 m2
Pris pr. md.
Ca. 500 EUR pr md
Område
Pirkkala, Pirkanmaa
Type
Industrial property
Industrial property in Pirkkala, Pirkanmaa
 More info
Industrial property in Pirkkala, Pirkanmaa
Industrial property for rent in Pirkkala, Pirkanmaa
Areal
-
Pris pr. md.
Ca. 2,450 EUR pr md
Område
Pirkkala, Pirkanmaa
Type
Industrial property
Warehouse in Pirkkala, Pirkanmaa
More info
We monitor the market!
Warehouse in Pirkkala, Pirkanmaa
Varasto Vuokrattavana sisälläPirkkala, Pirkanmaa
Areal
Ca. 425 m2
Pris pr. md.
Ca. 5,100 EUR pr md
Område
Pirkkala, Pirkanmaa
Type
Warehouse
Warehouse in Pirkkala, Pirkanmaa
More info
We monitor the market!
Warehouse in Pirkkala, Pirkanmaa
Varasto Vuokrattavana sisälläPirkkala, Pirkanmaa
Areal
Ca. 195 m2
Pris pr. md.
Ca. 2,150 EUR pr md
Område
Pirkkala, Pirkanmaa
Type
Warehouse
Warehouse in Pirkkala, Pirkanmaa
More info
We monitor the market!
Warehouse in Pirkkala, Pirkanmaa
Varasto Vuokrattavana sisälläPirkkala, Pirkanmaa
Areal
Ca. 145 m2
Pris pr. md.
Ca. 1,600 EUR pr md
Område
Pirkkala, Pirkanmaa
Type
Warehouse
Warehouse in Pirkkala, Pirkanmaa
More info
We monitor the market!
Warehouse in Pirkkala, Pirkanmaa
Varasto Vuokrattavana sisälläPirkkala, Pirkanmaa
Areal
Ca. 50 m2
Pris pr. md.
Ca. 600 EUR pr md
Område
Pirkkala, Pirkanmaa
Type
Warehouse
Warehouse in Pirkkala, Pirkanmaa
More info
We monitor the market!
Warehouse in Pirkkala, Pirkanmaa
Varasto Vuokrattavana sisälläPirkkala, Pirkanmaa
Areal
Ca. 200 m2
Pris pr. md.
Ca. 2,400 EUR pr md
Område
Pirkkala, Pirkanmaa
Type
Warehouse
Warehouse in Pirkkala, Pirkanmaa
More info
We monitor the market!
Warehouse in Pirkkala, Pirkanmaa
Varasto Vuokrattavana sisälläPirkkala, Pirkanmaa
Areal
Ca. 320 m2
Pris pr. md.
Ca. 3,400 EUR pr md
Område
Pirkkala, Pirkanmaa
Type
Warehouse
Industrial property in Pirkkala, Pirkanmaa
More info
We monitor the market!
Industrial property in Pirkkala, Pirkanmaa
Industrial property for rent in Pirkkala, Pirkanmaa
Areal
-
Pris pr. md.
Ca. 7,750 EUR pr md
Område
Pirkkala, Pirkanmaa
Type
Industrial property
Industrial property in Pirkkala, Pirkanmaa
More info
We monitor the market!
Industrial property in Pirkkala, Pirkanmaa
Industrial property for rent in Pirkkala, Pirkanmaa
Areal
-
Pris pr. md.
Ca. 5,250 EUR pr md
Område
Pirkkala, Pirkanmaa
Type
Industrial property
Industrial property in Pirkkala, Pirkanmaa
More info
We monitor the market!
Industrial property in Pirkkala, Pirkanmaa
Industrial property for rent in Pirkkala, Pirkanmaa
Areal
-
Pris pr. md.
Ca. 1,250 EUR pr md
Område
Pirkkala, Pirkanmaa
Type
Industrial property
Industrial property in Pirkkala, Pirkanmaa
 More info
Industrial property in Pirkkala, Pirkanmaa
Industrial property for rent in Pirkkala, Pirkanmaa
Areal
Ca. 2,000 m2
Pris pr. md.
Not stated
Område
Pirkkala, Pirkanmaa
Type
Industrial property
Industrial property in Pirkkala, Pirkanmaa
 More info
Industrial property in Pirkkala, Pirkanmaa
Industrial property for rent in Pirkkala, Pirkanmaa
Areal
Ca. 3,450 m2
Pris pr. md.
Not stated
Område
Pirkkala, Pirkanmaa
Type
Industrial property
Industrial property in Pirkkala, Pirkanmaa
 More info
Industrial property in Pirkkala, Pirkanmaa
Industrial property for rent in Pirkkala, Pirkanmaa
Areal
35 - 717 m2
Pris pr. md.
Not stated
Område
Pirkkala, Pirkanmaa
Type
Industrial property
Industrial property in Pirkkala, Pirkanmaa
 More info
Industrial property in Pirkkala, Pirkanmaa
Industrial property for rent in Pirkkala, Pirkanmaa
Areal
Ca. 3,145 m2
Pris pr. md.
Not stated
Område
Pirkkala, Pirkanmaa
Type
Industrial property
Selected customers
30,000 customers use Companyspace.com
30,000 customers
285,000 companies in our database
2,400 rentals annually
Companyspace.com is used by thousands of landlords, property companies, commercial real estate agents, investors and business centres seeking greater visibility, more enquiries and lower vacancy rates.


