


Industrial properties in Finland
Companyspace.com today:
New today 732
Updated 24h 1,316
Notifications about new companyspaces1,692
Copenhagen +2
Stockholm +1
Vienna +19
Paris +6
Madrid +13
Dublin (county) +54
Warsaw +4
Greater London +8
Latest update 41 min ago
Active ads 361,101
3,005 industrial properties found
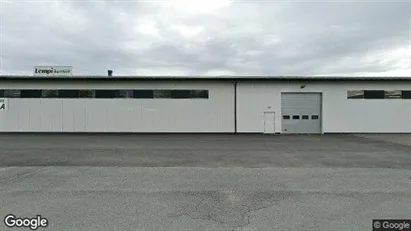
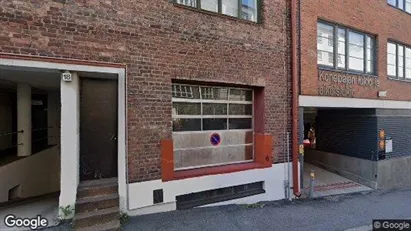
Industrial property in Akaa, Pirkanmaa
 More info
Industrial property in Akaa, Pirkanmaa
Teollisuuskiinteistö Vuokrattavana sisälläAkaa, Pirkanmaa
Areal
Ca. 1,600 m2
Pris pr. md.
Ca. 680,000 EUR pr md
Område
Akaa, Pirkanmaa
Type
Industrial property
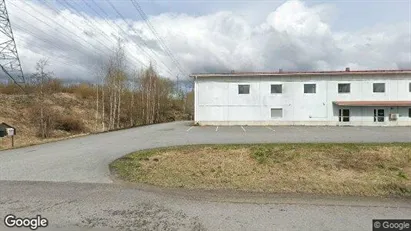
Industrial property in Tampere Kaakkoinen, Tampere
 More info
Industrial property in Tampere Kaakkoinen, Tampere
Teollisuuskiinteistö Vuokrattavana sisälläTampere Kaakkoinen, Tampere
Areal
-
Pris pr. md.
Ca. 720,000 EUR pr md
Område
Tampere Kaakkoinen, Tampere
Type
Industrial property
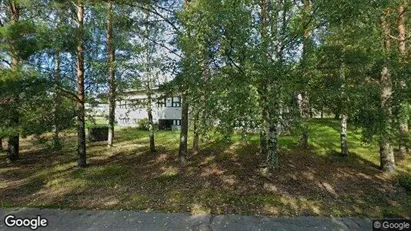
Industrial property in Ylöjärvi, Pirkanmaa
 More info
Industrial property in Ylöjärvi, Pirkanmaa
Teollisuuskiinteistö Vuokrattavana sisälläYlöjärvi, Pirkanmaa
Areal
Ca. 1,390 m2
Pris pr. md.
Ca. 1,450,000 EUR pr md
Område
Ylöjärvi, Pirkanmaa
Type
Industrial property
Industrial property in Kangasala, Pirkanmaa
 More info
Industrial property in Kangasala, Pirkanmaa
Teollisuuskiinteistö Vuokrattavana sisälläKangasala, Pirkanmaa
Areal
Ca. 1,270 m2
Pris pr. md.
Ca. 1,150,000 EUR pr md
Område
Kangasala, Pirkanmaa
Type
Industrial property
Industrial property in Helsinki Keskinen, Helsinki
 More info
Industrial property in Helsinki Keskinen, Helsinki
Teollisuuskiinteistö Vuokrattavana sisälläHelsinki Keskinen, Helsinki
Areal
Ca. 200 m2
Pris pr. md.
Ca. 37,500 EUR pr md
Område
Helsinki Keskinen, Helsinki
Type
Industrial property
Industrial property in Loimaa, Varsinais-Suomi
 More info
Industrial property in Loimaa, Varsinais-Suomi
Teollisuuskiinteistö Vuokrattavana sisälläLoimaa, Varsinais-Suomi
Areal
Ca. 13,200 m2
Pris pr. md.
Ca. 82,500 EUR pr md
Område
Loimaa, Varsinais-Suomi
Type
Industrial property
Office space in Turku, Varsinais-Suomi
 More info
Office space in Turku, Varsinais-Suomi
Office space for rent in Turku, Varsinais-Suomi
Areal
Ca. 750 m2
Pris pr. md.
Ca. 12,950 EUR pr md
Område
Turku, Varsinais-Suomi
Type
Office space
Industrial property in Porvoo, Uusimaa
 More info
Industrial property in Porvoo, Uusimaa
Industrial property for rent in Porvoo, Uusimaa
Areal
150 - 1,000 m2
Pris pr. md.
Not stated
Område
Porvoo, Uusimaa
Type
Industrial property
Industrial property in Ulvila, Satakunta
More info
We monitor the market!
Industrial property in Ulvila, Satakunta
Industrial property for rent in Ulvila, Satakunta
Areal
Ca. 700 m2
Pris pr. md.
Ca. 3,900 EUR pr md
Område
Ulvila, Satakunta
Type
Industrial property
Industrial property in Kontiolahti, Pohjois-Karjala
More info
We monitor the market!
Industrial property in Kontiolahti, Pohjois-Karjala
Industrial property for rent in Kontiolahti, Pohjois-Karjala
Areal
Ca. 150 m2
Pris pr. md.
Ca. 600 EUR pr md
Område
Kontiolahti, Pohjois-Karjala
Type
Industrial property
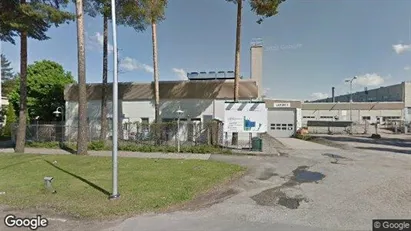
Industrial property in Oulu, Pohjois-Pohjanmaa
More info
We monitor the market!
Industrial property in Oulu, Pohjois-Pohjanmaa
Industrial property for rent in Oulu, Pohjois-Pohjanmaa
Areal
Ca. 1,235 m2
Pris pr. md.
Ca. 7,900 EUR pr md
Område
Oulu, Pohjois-Pohjanmaa
Type
Industrial property
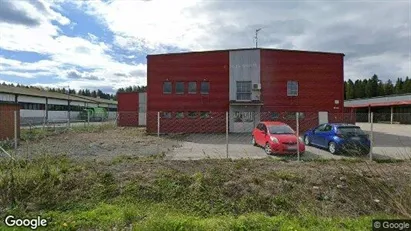
Industrial property in Akaa, Pirkanmaa
More info
We monitor the market!
Industrial property in Akaa, Pirkanmaa
Industrial property for rent in Akaa, Pirkanmaa
Areal
Ca. 415 m2
Pris pr. md.
Ca. 4,000 EUR pr md
Område
Akaa, Pirkanmaa
Type
Industrial property
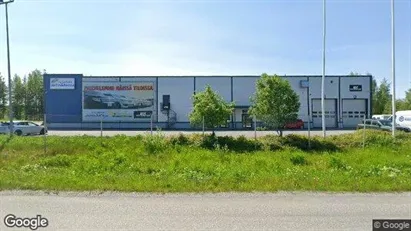
Industrial property in Akaa, Pirkanmaa
More info
We monitor the market!
Industrial property in Akaa, Pirkanmaa
Industrial property for rent in Akaa, Pirkanmaa
Areal
Ca. 105 m2
Pris pr. md.
Ca. 1,000 EUR pr md
Område
Akaa, Pirkanmaa
Type
Industrial property
Industrial property in Vantaa, Uusimaa
More info
We monitor the market!
Industrial property in Vantaa, Uusimaa
Industrial property for rent in Vantaa, Uusimaa
Areal
Ca. 950 m2
Pris pr. md.
Ca. 8,100 EUR pr md
Område
Vantaa, Uusimaa
Type
Industrial property
Industrial property in Helsinki Itäinen, Helsinki
More info
We monitor the market!
Industrial property in Helsinki Itäinen, Helsinki
Industrial property for rent in Helsinki Itäinen, Helsinki
Areal
Ca. 300 m2
Pris pr. md.
Ca. 1,800 EUR pr md
Område
Helsinki Itäinen, Helsinki
Type
Industrial property
Industrial property in Kaarina, Varsinais-Suomi
More info
We monitor the market!
Industrial property in Kaarina, Varsinais-Suomi
Industrial property for rent in Kaarina, Varsinais-Suomi
Areal
Ca. 140 m2
Pris pr. md.
Ca. 1,200 EUR pr md
Område
Kaarina, Varsinais-Suomi
Type
Industrial property
Industrial property in Nousiainen, Varsinais-Suomi
More info
We monitor the market!
Industrial property in Nousiainen, Varsinais-Suomi
Industrial property for rent in Nousiainen, Varsinais-Suomi
Areal
Ca. 60 m2
Pris pr. md.
Ca. 200 EUR pr md
Område
Nousiainen, Varsinais-Suomi
Type
Industrial property
Industrial property in Pori, Satakunta
More info
We monitor the market!
Industrial property in Pori, Satakunta
Industrial property for rent in Pori, Satakunta
Areal
Ca. 30 m2
Pris pr. md.
Ca. 300 EUR pr md
Område
Pori, Satakunta
Type
Industrial property
Selected customers
30,000 customers use Companyspace.com
30,000 customers
285,000 companies in our database
2,400 rentals annually
Companyspace.com is used by thousands of landlords, property companies, commercial real estate agents, investors and business centres seeking greater visibility, more enquiries and lower vacancy rates.


