


Shop for rent in Højbjerg
There are 11 available shopsin Højbjerg right now. Companyspace.com collects shops from many different parts of the market, so that you as a company can more easily get an overview of available shopsin Højbjerg.
Companyspace.com today:
New today 156
Updated 24h 381
Notifications about new companyspaces58
Copenhagen +2
Stockholm +4
Amsterdam +1
Brussels +2
Vienna +5
Paris +1
Roma (region) +2
Latest update 2 min ago
Active ads 369,065
11 shops found
Restaurant in Højbjerg, Aarhus
More info
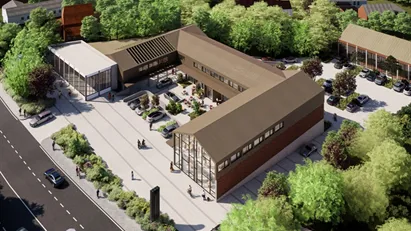

Restaurant in Højbjerg, Aarhus
Restaurant for rent in Højbjerg, Aarhus
Areal
136 - 280 m2
Pris pr. md.
Not stated
Område
Højbjerg, Aarhus
Type
Restaurant
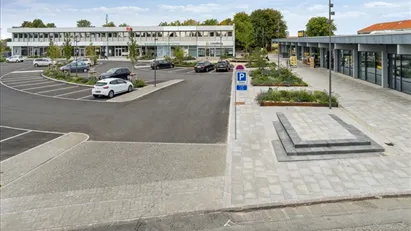
Shop in Højbjerg, Aarhus
More info

Shop in Højbjerg, Aarhus
Shop for rent in Højbjerg, Aarhus
Areal
368 - 1,115 m2
Pris pr. md.
Not stated
Område
Højbjerg, Aarhus
Type
Shop
Shop in Højbjerg, Aarhus
 More info
Shop in Højbjerg, Aarhus
Shop for rent in Højbjerg, Aarhus
Areal
Ca. 1,100 m2
Pris pr. md.
Ca. 90,000 DKK pr md
Område
Højbjerg, Aarhus
Type
Shop
Shop in Højbjerg, Aarhus
More info
We monitor the market!
Shop in Højbjerg, Aarhus
Shop for rent in Højbjerg, Aarhus
Areal
Ca. 95 m2
Pris pr. md.
Ca. 7,500 DKK pr md
Område
Højbjerg, Aarhus
Type
Shop
Shop in Højbjerg, Aarhus
More info
We monitor the market!
Shop in Højbjerg, Aarhus
Shop for rent in Højbjerg, Aarhus
Areal
Ca. 100 m2
Pris pr. md.
Ca. 20,850 DKK pr md
Område
Højbjerg, Aarhus
Type
Shop
Shop in Højbjerg, Aarhus
More info
We monitor the market!
Shop in Højbjerg, Aarhus
Shop for rent in Højbjerg, Aarhus
Areal
Ca. 365 m2
Pris pr. md.
Ca. 44,350 DKK pr md
Område
Højbjerg, Aarhus
Type
Shop
Shop in Højbjerg, Aarhus
More info
We monitor the market!
Shop in Højbjerg, Aarhus
Shop for rent in Højbjerg, Aarhus
Areal
Ca. 305 m2
Pris pr. md.
Ca. 37,900 DKK pr md
Område
Højbjerg, Aarhus
Type
Shop
Shop in Højbjerg, Aarhus
More info
We monitor the market!
Shop in Højbjerg, Aarhus
Shop for rent in Højbjerg, Aarhus
Areal
Ca. 180 m2
Pris pr. md.
Ca. 33,000 DKK pr md
Område
Højbjerg, Aarhus
Type
Shop
Shop in Højbjerg, Aarhus
More info
We monitor the market!
Shop in Højbjerg, Aarhus
Shop for rent in Højbjerg, Aarhus
Areal
Ca. 370 m2
Pris pr. md.
Ca. 52,900 DKK pr md
Område
Højbjerg, Aarhus
Type
Shop
Shop in Højbjerg, Aarhus
More info
We monitor the market!
Shop in Højbjerg, Aarhus
Shop for rent in Højbjerg, Aarhus
Areal
Ca. 1,100 m2
Pris pr. md.
Ca. 90,000 DKK pr md
Område
Højbjerg, Aarhus
Type
Shop
Shop in Højbjerg, Aarhus
More info
We monitor the market!
Shop in Højbjerg, Aarhus
Shop for rent in Højbjerg, Aarhus
Areal
Ca. 450 m2
Pris pr. md.
Ca. 22,550 DKK pr md
Område
Højbjerg, Aarhus
Type
Shop
Selected customers
30,000 customers use Companyspace.com
30,000 customers
285,000 companies in our database
2,400 rentals annually
Companyspace.com is used by thousands of landlords, property companies, commercial real estate agents, investors and business centres seeking greater visibility, more enquiries and lower vacancy rates.


