


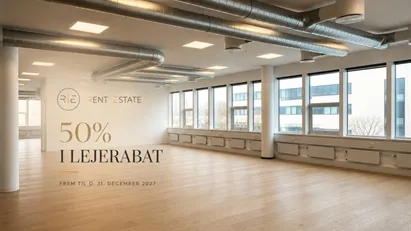
Office space for rent in Ballerup
There are 160 available office spacesin Ballerup right now. Companyspace.com collects office spaces from many different parts of the market, so that you as a company can more easily get an overview of available office spacesin Ballerup.
Companyspace.com today:
New today 874
Updated 24h 2,928
Notifications about new companyspaces6,715
Copenhagen +1
Stockholm +1
Berlin +115
Vienna +12
Roma (region) +1
Greater London +1
Latest update 2 h ago
Active ads 365,868
160 office spaces found
Office space in Ballerup, Greater Copenhagen
More info
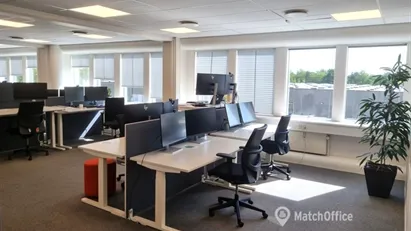

Office space in Ballerup, Greater Copenhagen
Office space for rent in Ballerup, Greater Copenhagen
Areal
700 m2
Pris pr. md.
35,000 DKK pr md
Område
Ballerup, Greater Copenhagen
Type
Office space
Office space in Ballerup, Greater Copenhagen
More info
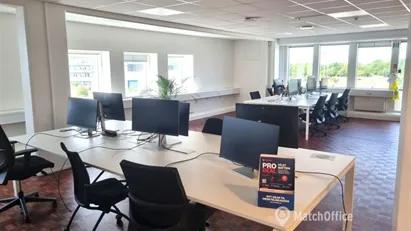
Office space in Ballerup, Greater Copenhagen
Office space for rent in Ballerup, Greater Copenhagen
Areal
500 m2
Pris pr. md.
25,000 DKK pr md
Område
Ballerup, Greater Copenhagen
Type
Office space
Office space in Ballerup, Greater Copenhagen
More info
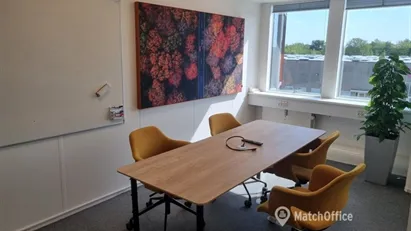
Office space in Ballerup, Greater Copenhagen
Office space for rent in Ballerup, Greater Copenhagen
Areal
400 m2
Pris pr. md.
20,000 DKK pr md
Område
Ballerup, Greater Copenhagen
Type
Office space
Office space in Ballerup, Greater Copenhagen
More info
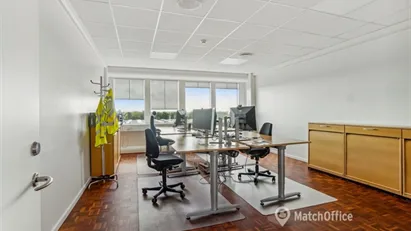
Office space in Ballerup, Greater Copenhagen
Office space for rent in Ballerup, Greater Copenhagen
Areal
1,500 m2
Pris pr. md.
75,000 DKK pr md
Område
Ballerup, Greater Copenhagen
Type
Office space
Office space in Ballerup, Greater Copenhagen
More info

Office space in Ballerup, Greater Copenhagen
Office space for rent in Ballerup, Greater Copenhagen
Areal
666 - 1,517 m2
Pris pr. md.
113,143 DKK pr md
Område
Ballerup, Greater Copenhagen
Type
Office space
Office space in Ballerup, Greater Copenhagen
More info
Office space in Ballerup, Greater Copenhagen
Office space for rent in Ballerup, Greater Copenhagen
Areal
537 - 2,147 m2
Pris pr. md.
159,236 DKK pr md
Område
Ballerup, Greater Copenhagen
Type
Office space
Office space in Ballerup, Greater Copenhagen
More info
Office space in Ballerup, Greater Copenhagen
Office space for rent in Ballerup, Greater Copenhagen
Areal
2,500 m2
Pris pr. md.
125,000 DKK pr md
Område
Ballerup, Greater Copenhagen
Type
Office space
Office space in Ballerup, Greater Copenhagen
More info
Office space in Ballerup, Greater Copenhagen
Office space for rent in Ballerup, Greater Copenhagen
Areal
1,000 m2
Pris pr. md.
50,000 DKK pr md
Område
Ballerup, Greater Copenhagen
Type
Office space
Coworking space in Ballerup, Greater Copenhagen
More info


Coworking space in Ballerup, Greater Copenhagen
Coworking space for rent in Ballerup, Greater Copenhagen
Areal
1 - 100 locations
Pris pr. md.
Not stated
Område
Ballerup, Greater Copenhagen
Type
Coworking space
Office space in Ballerup, Greater Copenhagen
More info
Office space in Ballerup, Greater Copenhagen
Office space for rent in Ballerup, Greater Copenhagen
Areal
1 - 200 m2
Pris pr. md.
Not stated
Område
Ballerup, Greater Copenhagen
Type
Office space
Office space in Ballerup, Greater Copenhagen
 More info
Office space in Ballerup, Greater Copenhagen
Office space for rent in Ballerup, Greater Copenhagen
Areal
22 m2
Pris pr. md.
3,667 DKK pr md
Område
Ballerup, Greater Copenhagen
Type
Office space
Office space in Ballerup, Greater Copenhagen
 More info
Office space in Ballerup, Greater Copenhagen
Office space for rent in Ballerup, Greater Copenhagen
Areal
Ca. 130 m2
Pris pr. md.
Ca. 11,900 DKK pr md
Område
Ballerup, Greater Copenhagen
Type
Office space
Office space in Ballerup, Greater Copenhagen
 More info
Office space in Ballerup, Greater Copenhagen
Office space for rent in Ballerup, Greater Copenhagen
Areal
Ca. 530 m2
Pris pr. md.
Not stated
Område
Ballerup, Greater Copenhagen
Type
Office space
Office space in Ballerup, Greater Copenhagen
 More info
Office space in Ballerup, Greater Copenhagen
Office space for rent in Ballerup, Greater Copenhagen
Areal
Ca. 240 m2
Pris pr. md.
Ca. 11,900 DKK pr md
Område
Ballerup, Greater Copenhagen
Type
Office space
Warehouse in Ballerup, Greater Copenhagen
 More info
Warehouse in Ballerup, Greater Copenhagen
Warehouse for rent in Ballerup, Greater Copenhagen
Areal
Ca. 735 m2
Pris pr. md.
Ca. 25,100 DKK pr md
Område
Ballerup, Greater Copenhagen
Type
Warehouse
Office space in Ballerup, Greater Copenhagen
 More info
Office space in Ballerup, Greater Copenhagen
Office space for rent in Ballerup, Greater Copenhagen
Areal
Ca. 70 m2
Pris pr. md.
Ca. 8,650 DKK pr md
Område
Ballerup, Greater Copenhagen
Type
Office space
Office space in Ballerup, Greater Copenhagen
More info
Office space in Ballerup, Greater Copenhagen
Office space for rent in Ballerup, Greater Copenhagen
Areal
Ca. 70 m2
Pris pr. md.
Ca. 8,650 DKK pr md
Område
Ballerup, Greater Copenhagen
Type
Office space
Office space in Ballerup, Greater Copenhagen
More info
Office space in Ballerup, Greater Copenhagen
Office space for rent in Ballerup, Greater Copenhagen
Areal
Ca. 625 m2
Pris pr. md.
Ca. 60,000 DKK pr md
Område
Ballerup, Greater Copenhagen
Type
Office space
Selected customers
30,000 customers use Companyspace.com
30,000 customers
285,000 companies in our database
2,400 rentals annually
Companyspace.com is used by thousands of landlords, property companies, commercial real estate agents, investors and business centres seeking greater visibility, more enquiries and lower vacancy rates.


