


Industrial property for rent in Virum
These commercial premises are closest to your search
We currently have no available commercial premises registered that match your search exactly. Therefore, we show below the commercial premises that best match your search based on the current market.
The shown listings may differ from your original search in terms of, for example, premises type, location, size or price, but they have been selected because they may be relevant alternatives for your business.
Take a look at the suggestions below – or start your search again here.
Companyspace.com today:
New today 874
Updated 24h 2,841
Notifications about new companyspaces6,715
Copenhagen +1
Stockholm +1
Berlin +115
Vienna +12
Roma (region) +1
Greater London +1
Latest update 3 h ago
Active ads 365,868
Clinic in Rødovre, Greater Copenhagen
More info
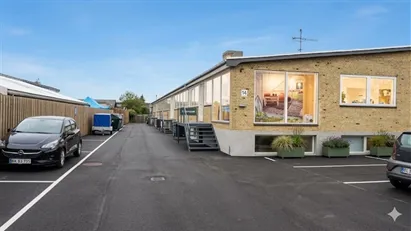

Clinic in Rødovre, Greater Copenhagen
Clinic for rent in Rødovre, Greater Copenhagen
Areal
384 m2
Pris pr. md.
21,120 DKK pr md
Område
Rødovre, Greater Copenhagen
Type
Clinic
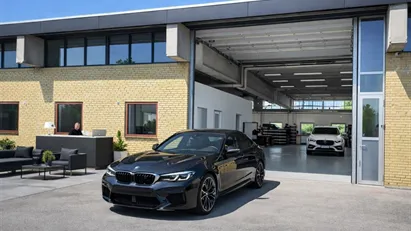
Industrial property in Vallensbæk, Greater Copenhagen
More info
Industrial property in Vallensbæk, Greater Copenhagen
Industrial property for rent in Vallensbæk, Greater Copenhagen
Areal
250 m2
Pris pr. md.
17,667 DKK pr md
Område
Vallensbæk, Greater Copenhagen
Type
Industrial property
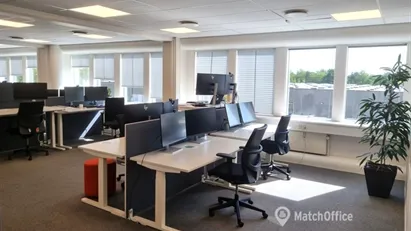
Coworking space in Vallensbæk, Greater Copenhagen
More info

Coworking space in Vallensbæk, Greater Copenhagen
Coworking space for rent in Vallensbæk, Greater Copenhagen
Areal
530 m2
Pris pr. md.
35,333 DKK pr md
Område
Vallensbæk, Greater Copenhagen
Type
Coworking space
Warehouse in Herlev, Greater Copenhagen
More info

Warehouse in Herlev, Greater Copenhagen
Warehouse for rent in Herlev, Greater Copenhagen
Areal
1,239 m2
Pris pr. md.
30,975 DKK pr md
Område
Herlev, Greater Copenhagen
Type
Warehouse
Warehouse in Taastrup, Greater Copenhagen
More info
Warehouse in Taastrup, Greater Copenhagen
Warehouse for rent in Taastrup, Greater Copenhagen
Areal
123 m2
Pris pr. md.
Not stated
Område
Taastrup, Greater Copenhagen
Type
Warehouse
Warehouse in Herlev, Greater Copenhagen
More info
Warehouse in Herlev, Greater Copenhagen
Warehouse for rent in Herlev, Greater Copenhagen
Areal
25 - 113 m2
Pris pr. md.
Not stated
Område
Herlev, Greater Copenhagen
Type
Warehouse
Office space in Copenhagen K, Copenhagen
More info

Office space in Copenhagen K, Copenhagen
Office space for rent in Copenhagen K, Copenhagen
Areal
605 - 2,797 m2
Pris pr. md.
Not stated
Område
Copenhagen K, Copenhagen
Type
Office space
Warehouse in Glostrup, Greater Copenhagen
More info
Warehouse in Glostrup, Greater Copenhagen
Warehouse for rent in Glostrup, Greater Copenhagen
Areal
42 m2
Pris pr. md.
3,830 DKK pr md
Område
Glostrup, Greater Copenhagen
Type
Warehouse
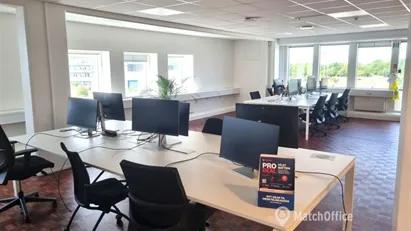
Coworking space in Vallensbæk, Greater Copenhagen
More info

Coworking space in Vallensbæk, Greater Copenhagen
Coworking space for rent in Vallensbæk, Greater Copenhagen
Areal
530 m2
Pris pr. md.
35,333 DKK pr md
Område
Vallensbæk, Greater Copenhagen
Type
Coworking space
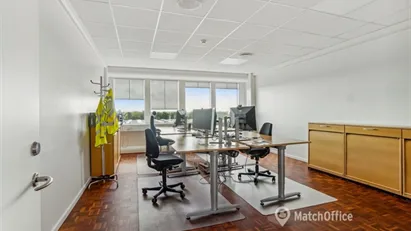
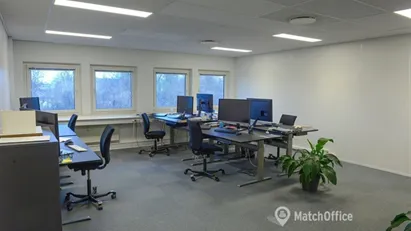
Office space in Ballerup, Greater Copenhagen
More info

Office space in Ballerup, Greater Copenhagen
Office space for rent in Ballerup, Greater Copenhagen
Areal
700 m2
Pris pr. md.
35,000 DKK pr md
Område
Ballerup, Greater Copenhagen
Type
Office space
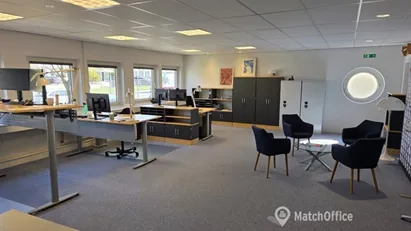
Office space in Ballerup, Greater Copenhagen
More info
Office space in Ballerup, Greater Copenhagen
Office space for rent in Ballerup, Greater Copenhagen
Areal
500 m2
Pris pr. md.
25,000 DKK pr md
Område
Ballerup, Greater Copenhagen
Type
Office space
Office space in Ballerup, Greater Copenhagen
More info
Office space in Ballerup, Greater Copenhagen
Office space for rent in Ballerup, Greater Copenhagen
Areal
400 m2
Pris pr. md.
20,000 DKK pr md
Område
Ballerup, Greater Copenhagen
Type
Office space
Industrial property in Glostrup, Greater Copenhagen
More info
Industrial property in Glostrup, Greater Copenhagen
Industrial property for rent in Glostrup, Greater Copenhagen
Areal
543 m2
Pris pr. md.
40,182 DKK pr md
Område
Glostrup, Greater Copenhagen
Type
Industrial property
Industrial property in Glostrup, Greater Copenhagen
More info
Industrial property in Glostrup, Greater Copenhagen
Industrial property for rent in Glostrup, Greater Copenhagen
Areal
362 m2
Pris pr. md.
26,788 DKK pr md
Område
Glostrup, Greater Copenhagen
Type
Industrial property
Industrial property in Herlev, Greater Copenhagen
More info

Industrial property in Herlev, Greater Copenhagen
Industrial property for rent in Herlev, Greater Copenhagen
Areal
-
Pris pr. md.
3,400 DKK pr md
Område
Herlev, Greater Copenhagen
Type
Industrial property
Office space in Ballerup, Greater Copenhagen
More info
Office space in Ballerup, Greater Copenhagen
Office space for rent in Ballerup, Greater Copenhagen
Areal
1,500 m2
Pris pr. md.
75,000 DKK pr md
Område
Ballerup, Greater Copenhagen
Type
Office space
Office space in Herlev, Greater Copenhagen
More info
Office space in Herlev, Greater Copenhagen
Office space for rent in Herlev, Greater Copenhagen
Areal
340 m2
Pris pr. md.
13,600 DKK pr md
Område
Herlev, Greater Copenhagen
Type
Office space
Office space in Herlev, Greater Copenhagen
More info
Office space in Herlev, Greater Copenhagen
Office space for rent in Herlev, Greater Copenhagen
Areal
215 m2
Pris pr. md.
9,675 DKK pr md
Område
Herlev, Greater Copenhagen
Type
Office space
Selected customers
30,000 customers use Companyspace.com
30,000 customers
285,000 companies in our database
2,400 rentals annually
Companyspace.com is used by thousands of landlords, property companies, commercial real estate agents, investors and business centres seeking greater visibility, more enquiries and lower vacancy rates.


