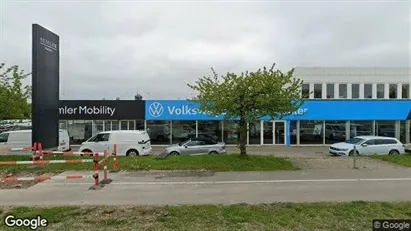
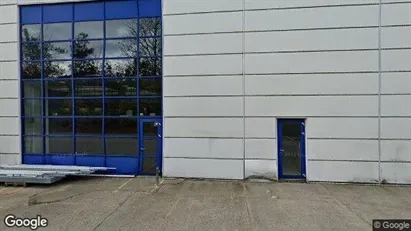
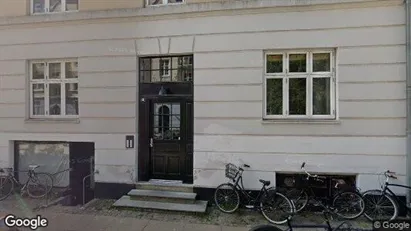
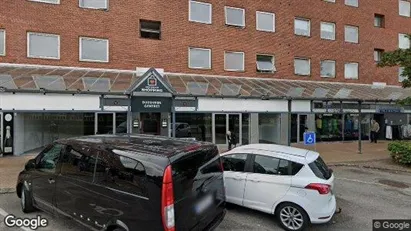
Garage for rent in Greater Copenhagen
-
1537 m2 office space for rent in Herlev, Greater Copenhagen
- 57,638 DKK per month
- 450 DKK /m2/year
-
1372 m2 office space for rent in Hvidovre, Greater Copenhagen
- 94,325 DKK per month
- 825 DKK /m2/year
-
735 m2 warehouse for rent in Hedehusene, Greater Copenhagen
- 48,333 DKK per month
- 789 DKK /m2/year
-
49 m2 office space for rent in Ballerup, Greater Copenhagen
- 7,800 DKK per month
- 1,910 DKK /m2/year
-
51 m2 warehouse for rent in Copenhagen K, Copenhagen
- 3,500 DKK per month
- 824 DKK /m2/year
-
35 m2 warehouse for rent in Ballerup, Greater Copenhagen
- 5,000 DKK per month
- 1,714 DKK /m2/year
-
54 m2 office space for rent in Brøndby, Greater Copenhagen
- 3,500 DKK per month
- 777 DKK /m2/year
-
1552 m2 warehouse for rent in Ballerup, Greater Copenhagen
- 87,947 DKK per month
- 680 DKK /m2/year
-
10 m2 warehouse for rent in Charlottenlund, Greater Copenhagen
- 900 DKK per month
- 1,080 DKK /m2/year
-
3463 m2 warehouse for rent in Brøndby, Greater Copenhagen
- 4,120,833 DKK per month
- 14,279 DKK /m2/year
-
13000 m2 warehouse for rent in Greve, Greater Copenhagen
- 890,417 DKK per month
- 821 DKK /m2/year
-
1468 m2 warehouse for rent in Brøndby, Greater Copenhagen
- 80,467 DKK per month
- 657 DKK /m2/year
-
31 m2 warehouse for rent in Nørrebro, Copenhagen
- 1,808 DKK per month
- 700 DKK /m2/year
-
782 m2 industrial property for rent in Rødovre, Greater Copenhagen
- 32,583 DKK per month
- 500 DKK /m2/year
-
7 m2 warehouse for rent in Søborg, Greater Copenhagen
- 400 DKK per month
- 685 DKK /m2/year
Frequently asked questions
Statistics on the development of available garages for rent in Greater Copenhagen over the past month
Below you can see the development of available garages for rent in Greater Copenhagen over the past month. In the first column you see the date. In the second column you see the total amount of garages for rent in Greater Copenhagen on the date. In the third column you see the amount of new garages in Greater Copenhagen that was available for rent on the date. In the fourth column you see the amount of garages in Greater Copenhagen that was rented on the date. Also see aggregate statistics on all available garages in Greater Copenhagen over time, aggregate statistics on new garages in Greater Copenhagen over time, aggregate statistics on rented garages in Greater Copenhagen over time
| Date | All garages for rent | New garages for rent | Rented out garages |
|---|---|---|---|
| 8. November 2025 | 10 | 0 | 0 |
| 7. November 2025 | 10 | 0 | 0 |
| 6. November 2025 | 10 | 0 | 0 |
| 5. November 2025 | 10 | 0 | 0 |
| 4. November 2025 | 10 | 0 | 0 |
| 3. November 2025 | 10 | 2 | 2 |
| 2. November 2025 | 10 | 2 | 0 |
| 1. November 2025 | 8 | 2 | 2 |
| 31. October 2025 | 8 | 2 | 0 |
| 30. October 2025 | 6 | 0 | 0 |
| 29. October 2025 | 6 | 1 | 1 |
| 28. October 2025 | 6 | 1 | 0 |
| 27. October 2025 | 5 | 1 | 0 |
| 26. October 2025 | 4 | 0 | 0 |
| 25. October 2025 | 4 | 0 | 0 |
| 24. October 2025 | 4 | 0 | 0 |
| 23. October 2025 | 4 | 0 | 0 |
| 22. October 2025 | 4 | 0 | 0 |
| 21. October 2025 | 4 | 0 | 1 |
| 20. October 2025 | 5 | 0 | 1 |
| 19. October 2025 | 6 | 0 | 0 |
| 18. October 2025 | 6 | 1 | 0 |
| 17. October 2025 | 5 | 0 | 0 |
| 16. October 2025 | 5 | 0 | 0 |
| 15. October 2025 | 5 | 0 | 0 |
| 14. October 2025 | 5 | 0 | 1 |
| 13. October 2025 | 6 | 0 | 1 |
| 12. October 2025 | 7 | 1 | 0 |
| 11. October 2025 | 6 | 0 | 0 |
| 10. October 2025 | 6 | 0 | 0 |
| 9. October 2025 | 6 | 0 | 0 |
Statistics on currently available garages for rent in Greater Copenhagen in Denmark
In the table below, you see a series of data about available garages to rent in Greater Copenhagen.Also see gathered statistics of all available garages in Greater Copenhagen over time, the gathered statistics of new garages in Greater Copenhagen over time, the gathered statistics of rented garages in Greater Copenhagen over time
| Garages | |
|---|---|
| Available premises | 10 |
| New premises since yesterday | 0 |
| Rented out premises since yesterday | 0 |
| Total available m2 | 181 |
| Average price per m2 per year without expenses | 72 |
| Highest price per m2 per year | 113 |
| Lowest price per m2 per year | 48 |


