


Commercial property for rent in Glostrup
There are 18 available commercial propertiesin Glostrup right now. Companyspace.com collects commercial properties from many different parts of the market, so that you as a company can more easily get an overview of available commercial propertiesin Glostrup.
Companyspace.com today:
New today 204
Updated 24h 1,991
Notifications about new companyspaces10
Madrid +12
Latest update 40 min ago
Active ads 365,367
18 commercial properties found
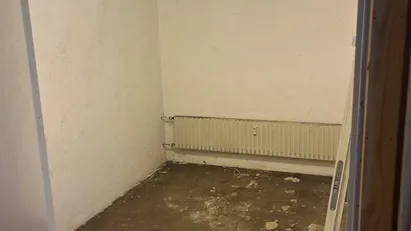
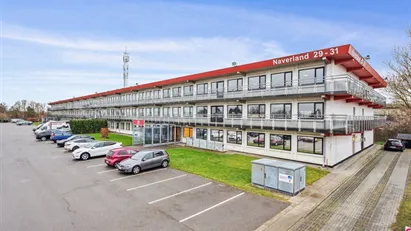
Commercial space in Glostrup, Greater Copenhagen
 More info
Commercial space in Glostrup, Greater Copenhagen
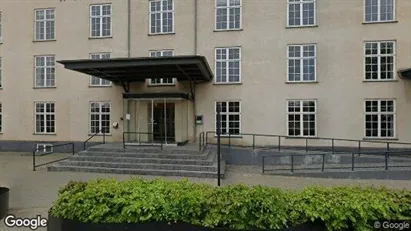
Commercial space for rent in Glostrup, Greater Copenhagen
Areal
Ca. 205 m2
Pris pr. md.
Not stated
Område
Glostrup, Greater Copenhagen
Type
Commercial property
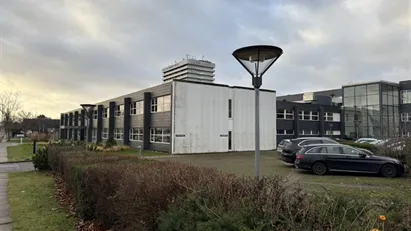
Commercial space in Glostrup, Greater Copenhagen
 More info
Commercial space in Glostrup, Greater Copenhagen
Commercial space for rent in Glostrup, Greater Copenhagen
Areal
-
Pris pr. md.
Not stated
Område
Glostrup, Greater Copenhagen
Type
Commercial property
Commercial space in Glostrup, Greater Copenhagen
 More info
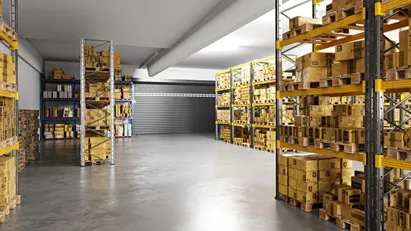
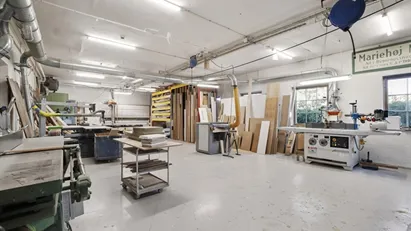
Commercial space in Glostrup, Greater Copenhagen
Commercial space for rent in Glostrup, Greater Copenhagen
Areal
Ca. 2,000 m2
Pris pr. md.
Ca. 50,000 DKK per month
Område
Glostrup, Greater Copenhagen
Type
Commercial property
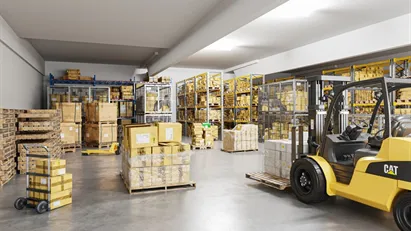
Warehouse in Glostrup, Greater Copenhagen
More info
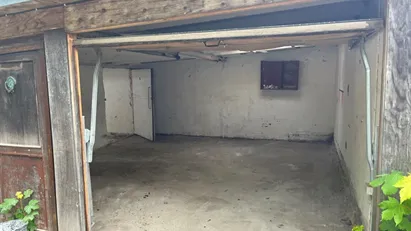

Warehouse in Glostrup, Greater Copenhagen
Warehouse for rent in Glostrup, Greater Copenhagen
Areal
42 m2
Pris pr. md.
3,830 DKK per month
Område
Glostrup, Greater Copenhagen
Type
Warehouse
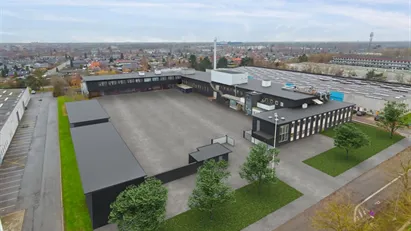
Industrial property in Glostrup, Greater Copenhagen
More info
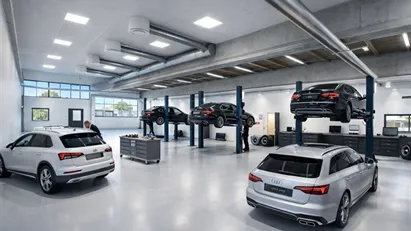

Industrial property in Glostrup, Greater Copenhagen
Industrial property for rent in Glostrup, Greater Copenhagen
Areal
543 m2
Pris pr. md.
40,182 DKK per month
Område
Glostrup, Greater Copenhagen
Type
Industrial property
Industrial property in Glostrup, Greater Copenhagen
More info
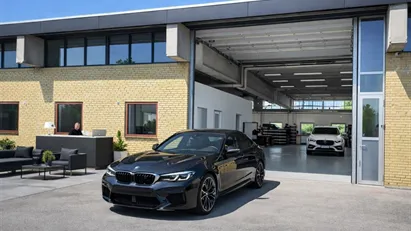
Industrial property in Glostrup, Greater Copenhagen
Industrial property for rent in Glostrup, Greater Copenhagen
Areal
362 m2
Pris pr. md.
26,788 DKK per month
Område
Glostrup, Greater Copenhagen
Type
Industrial property
Warehouse in Glostrup, Greater Copenhagen
More info
Warehouse in Glostrup, Greater Copenhagen
Warehouse for rent in Glostrup, Greater Copenhagen
Areal
19 m2
Pris pr. md.
924 DKK per month
Område
Glostrup, Greater Copenhagen
Type
Warehouse
Coworking space in Glostrup, Greater Copenhagen
More info

Coworking space in Glostrup, Greater Copenhagen
Coworking space for rent in Glostrup, Greater Copenhagen
Areal
1 - 5 locations
Pris pr. md.
Not stated
Område
Glostrup, Greater Copenhagen
Type
Coworking space
Warehouse in Glostrup, Greater Copenhagen
 More info
Warehouse in Glostrup, Greater Copenhagen
Warehouse for rent in Glostrup, Greater Copenhagen
Areal
25 m2
Pris pr. md.
1,354 DKK per month
Område
Glostrup, Greater Copenhagen
Type
Warehouse
Warehouse in Glostrup, Greater Copenhagen
 More info
Warehouse in Glostrup, Greater Copenhagen
Warehouse for rent in Glostrup, Greater Copenhagen
Areal
15 - 100 m2
Pris pr. md.
5,417 DKK per month
Område
Glostrup, Greater Copenhagen
Type
Warehouse
Warehouse in Glostrup, Greater Copenhagen
 More info
Warehouse in Glostrup, Greater Copenhagen
Warehouse for rent in Glostrup, Greater Copenhagen
Areal
45 m2
Pris pr. md.
2,438 DKK per month
Område
Glostrup, Greater Copenhagen
Type
Warehouse
Warehouse in Glostrup, Greater Copenhagen
 More info
Warehouse in Glostrup, Greater Copenhagen
Warehouse for rent in Glostrup, Greater Copenhagen
Areal
50 m2
Pris pr. md.
1,875 DKK per month
Område
Glostrup, Greater Copenhagen
Type
Warehouse
Office space in Glostrup, Greater Copenhagen
 More info
Office space in Glostrup, Greater Copenhagen
Office space for rent in Glostrup, Greater Copenhagen
Areal
230 m2
Pris pr. md.
18,688 DKK per month
Område
Glostrup, Greater Copenhagen
Type
Office space
Warehouse in Glostrup, Greater Copenhagen
 More info
Warehouse in Glostrup, Greater Copenhagen
Warehouse for rent in Glostrup, Greater Copenhagen
Areal
25 m2
Pris pr. md.
938 DKK per month
Område
Glostrup, Greater Copenhagen
Type
Warehouse
Warehouse in Glostrup, Greater Copenhagen
 More info
Warehouse in Glostrup, Greater Copenhagen
Warehouse for rent in Glostrup, Greater Copenhagen
Areal
100 m2
Pris pr. md.
3,750 DKK per month
Område
Glostrup, Greater Copenhagen
Type
Warehouse
Warehouse in Glostrup, Greater Copenhagen
 More info
Warehouse in Glostrup, Greater Copenhagen
Warehouse for rent in Glostrup, Greater Copenhagen
Areal
75 m2
Pris pr. md.
2,812 DKK per month
Område
Glostrup, Greater Copenhagen
Type
Warehouse
Office space in Glostrup, Greater Copenhagen
 More info
Office space in Glostrup, Greater Copenhagen
Office space for rent in Glostrup, Greater Copenhagen
Areal
306 m2
Pris pr. md.
13,388 DKK per month
Område
Glostrup, Greater Copenhagen
Type
Office space
Industrial property in Glostrup, Greater Copenhagen
 More info
Industrial property in Glostrup, Greater Copenhagen
Industrial property for rent in Glostrup, Greater Copenhagen
Areal
Ca. 400 m2
Pris pr. md.
Ca. 13,000 DKK per month
Område
Glostrup, Greater Copenhagen
Type
Industrial property
Selected customers


