


Commercial property for rent in Brabrand
There are 18 available commercial propertiesin Brabrand right now. Companyspace.com collects commercial properties from many different parts of the market, so that you as a company can more easily get an overview of available commercial propertiesin Brabrand.
Companyspace.com today:
New today 105
Updated 24h 622
Notifications about new companyspaces2,048
Copenhagen +4
Stockholm +2
Oslo +1
Brussels +4
Vienna +21
Roma (region) +1
Latest update 6 min ago
Active ads 371,358
18 commercial properties found
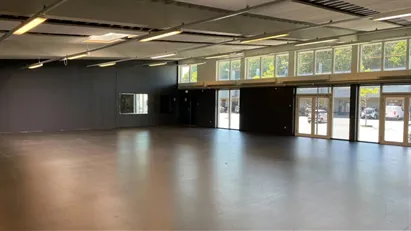
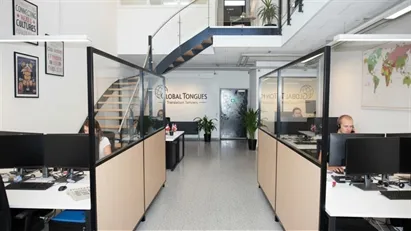
Office space in Brabrand, Aarhus
 More info
Office space in Brabrand, Aarhus
Office space for rent in Brabrand, Aarhus
Areal
139 m2
Pris pr. md.
9,267 DKK pr md
Område
Brabrand, Aarhus
Type
Office space
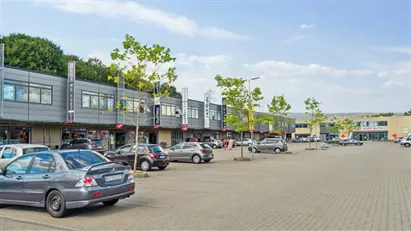
Shop in Brabrand, Aarhus
 More info
Shop in Brabrand, Aarhus
Shop for rent in Brabrand, Aarhus
Areal
300 m2
Pris pr. md.
20,000 DKK pr md
Område
Brabrand, Aarhus
Type
Shop
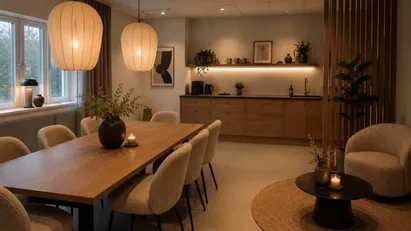
Office space in Brabrand, Aarhus
 More info
Office space in Brabrand, Aarhus
Office space for rent in Brabrand, Aarhus
Areal
127 m2
Pris pr. md.
8,467 DKK pr md
Område
Brabrand, Aarhus
Type
Office space
Office space in Brabrand, Aarhus
 More info
Office space in Brabrand, Aarhus
Office space for rent in Brabrand, Aarhus
Areal
350 m2
Pris pr. md.
29,167 DKK pr md
Område
Brabrand, Aarhus
Type
Office space
Office space in Brabrand, Aarhus
 More info
Office space in Brabrand, Aarhus
Office space for rent in Brabrand, Aarhus
Areal
169 m2
Pris pr. md.
7,859 DKK pr md
Område
Brabrand, Aarhus
Type
Office space
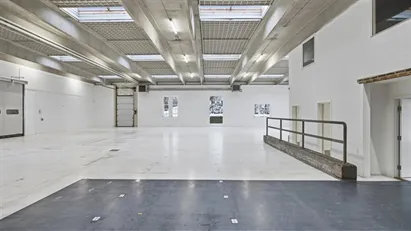
Warehouse in Brabrand, Aarhus
 More info
Warehouse in Brabrand, Aarhus
Warehouse for rent in Brabrand, Aarhus
Areal
982 m2
Pris pr. md.
53,192 DKK pr md
Område
Brabrand, Aarhus
Type
Warehouse
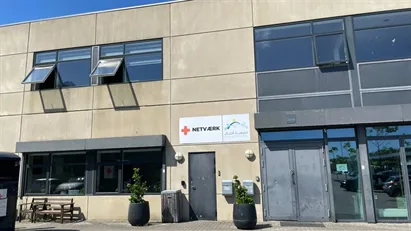
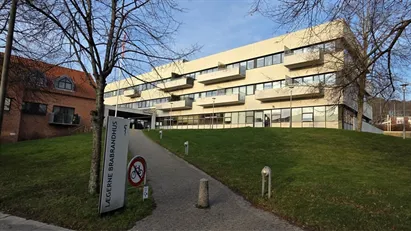
Clinic in Brabrand, Aarhus
 More info
Clinic in Brabrand, Aarhus
Clinic for rent in Brabrand, Aarhus
Areal
15 - 192 m2
Pris pr. md.
Ca. 200 DKK pr md
Område
Brabrand, Aarhus
Type
Clinic
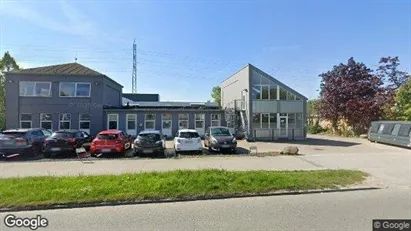
Office space in Brabrand, Aarhus
 More info
Office space in Brabrand, Aarhus
Office space for rent in Brabrand, Aarhus
Areal
Ca. 320 m2
Pris pr. md.
Ca. 11,500 DKK pr md
Område
Brabrand, Aarhus
Type
Office space
Warehouse in Brabrand, Aarhus
 More info
Warehouse in Brabrand, Aarhus
Warehouse for rent in Brabrand, Aarhus
Areal
Ca. 285 m2
Pris pr. md.
Ca. 19,800 DKK pr md
Område
Brabrand, Aarhus
Type
Warehouse
Warehouse in Brabrand, Aarhus
 More info
Warehouse in Brabrand, Aarhus
Warehouse for rent in Brabrand, Aarhus
Areal
Ca. 145 m2
Pris pr. md.
Ca. 9,900 DKK pr md
Område
Brabrand, Aarhus
Type
Warehouse
Warehouse in Brabrand, Aarhus
 More info
Warehouse in Brabrand, Aarhus
Warehouse for rent in Brabrand, Aarhus
Areal
Ca. 145 m2
Pris pr. md.
Ca. 9,900 DKK pr md
Område
Brabrand, Aarhus
Type
Warehouse
Office space in Brabrand, Aarhus
 More info
Office space in Brabrand, Aarhus
Office space for rent in Brabrand, Aarhus
Areal
Ca. 140 m2
Pris pr. md.
Ca. 7,500 DKK pr md
Område
Brabrand, Aarhus
Type
Office space
Warehouse in Brabrand, Aarhus
 More info
Warehouse in Brabrand, Aarhus
Warehouse for rent in Brabrand, Aarhus
Areal
Ca. 2,400 m2
Pris pr. md.
Ca. 160,000 DKK pr md
Område
Brabrand, Aarhus
Type
Warehouse
Warehouse in Brabrand, Aarhus
 More info
Warehouse in Brabrand, Aarhus
Warehouse for rent in Brabrand, Aarhus
Areal
Ca. 980 m2
Pris pr. md.
Ca. 53,200 DKK pr md
Område
Brabrand, Aarhus
Type
Warehouse
Office space in Brabrand, Aarhus
 More info
Office space in Brabrand, Aarhus
Office space for rent in Brabrand, Aarhus
Areal
Ca. 500 m2
Pris pr. md.
Ca. 41,650 DKK pr md
Område
Brabrand, Aarhus
Type
Office space
Office space in Brabrand, Aarhus
 More info
Office space in Brabrand, Aarhus
Office space for rent in Brabrand, Aarhus
Areal
Ca. 1,000 m2
Pris pr. md.
Ca. 83,350 DKK pr md
Område
Brabrand, Aarhus
Type
Office space
Office space in Brabrand, Aarhus
 More info
Office space in Brabrand, Aarhus
Office space for rent in Brabrand, Aarhus
Areal
Ca. 2,000 m2
Pris pr. md.
Ca. 166,650 DKK pr md
Område
Brabrand, Aarhus
Type
Office space
Office space in Brabrand, Aarhus
 More info
Office space in Brabrand, Aarhus
Office space for rent in Brabrand, Aarhus
Areal
Ca. 1,500 m2
Pris pr. md.
Ca. 125,000 DKK pr md
Område
Brabrand, Aarhus
Type
Office space
Selected customers
30,000 customers use Companyspace.com
30,000 customers
285,000 companies in our database
2,400 rentals annually
Companyspace.com is used by thousands of landlords, property companies, commercial real estate agents, investors and business centres seeking greater visibility, more enquiries and lower vacancy rates.


