


Commercial property for rentin Amager
There are 18 available commercial propertiesin Amager right now. Companyspace.com collects commercial properties from many different parts of the market, so that you as a company can more easily get an overview of available commercial propertiesin Amager.
Companyspace.com today:
New today 446
Updated 24h 580
Notifications about new companyspaces182
Stockholm +1
Amsterdam +15
Berlin +4
Brussels +2
Vienna +6
Warsaw +9
Roma (region) +1
Latest update 7 min ago
Active ads 371,991
18 commercial properties found
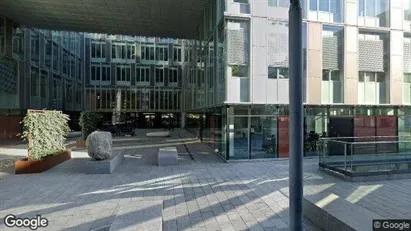
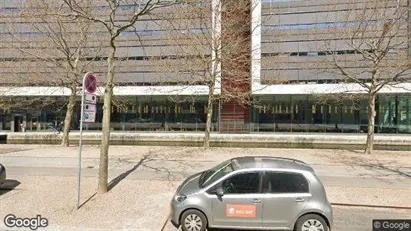
Office space in Copenhagen S, Copenhagen
 More info
Office space in Copenhagen S, Copenhagen
Office space for rent in Copenhagen S, Copenhagen
Areal
-
Pris pr. md.
Not stated
Område
Copenhagen S, Copenhagen
Type
Office space
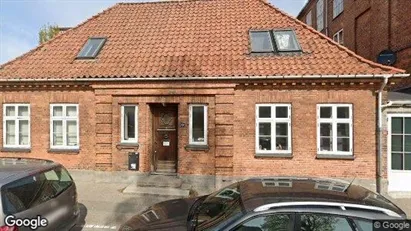
Office space in Copenhagen S, Copenhagen
 More info
Office space in Copenhagen S, Copenhagen
Office space for rent in Copenhagen S, Copenhagen
Areal
-
Pris pr. md.
Not stated
Område
Copenhagen S, Copenhagen
Type
Office space
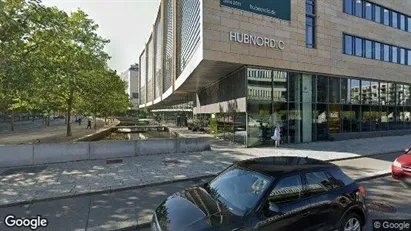
Office space in Copenhagen S, Copenhagen
 More info
Office space in Copenhagen S, Copenhagen
Office space for rent in Copenhagen S, Copenhagen
Areal
Ca. 1,130 m2
Pris pr. md.
Ca. 141,000 DKK pr md
Område
Copenhagen S, Copenhagen
Type
Office space
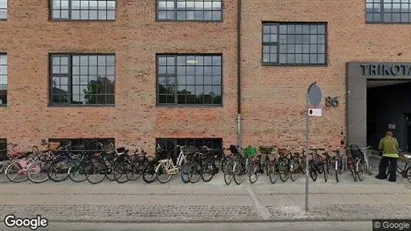
Warehouse in Copenhagen S, Copenhagen
 More info
Warehouse in Copenhagen S, Copenhagen
Warehouse for rent in Copenhagen S, Copenhagen
Areal
Ca. 35 m2
Pris pr. md.
Not stated
Område
Copenhagen S, Copenhagen
Type
Warehouse
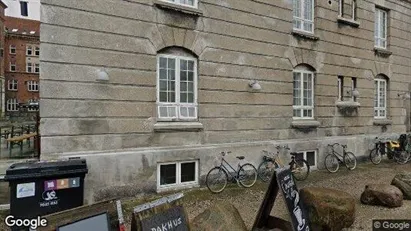
Office space in Copenhagen S, Copenhagen
 More info
Office space in Copenhagen S, Copenhagen
Office space for rent in Copenhagen S, Copenhagen
Areal
353 - 662 m2
Pris pr. md.
Ca. 52,900 DKK pr md
Område
Copenhagen S, Copenhagen
Type
Office space
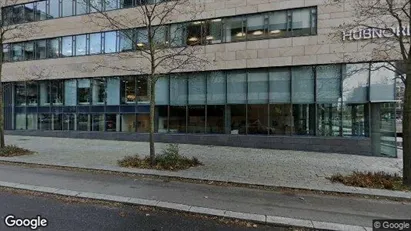
Office space in Copenhagen S, Copenhagen
 More info
Office space in Copenhagen S, Copenhagen
Office space for rent in Copenhagen S, Copenhagen
Areal
Ca. 1,380 m2
Pris pr. md.
Ca. 172,750 DKK pr md
Område
Copenhagen S, Copenhagen
Type
Office space
Office space in Copenhagen S, Copenhagen
 More info
Office space in Copenhagen S, Copenhagen
Office space for rent in Copenhagen S, Copenhagen
Areal
-
Pris pr. md.
Not stated
Område
Copenhagen S, Copenhagen
Type
Office space
Office space in Copenhagen S, Copenhagen
 More info
Office space in Copenhagen S, Copenhagen
Office space for rent in Copenhagen S, Copenhagen
Areal
-
Pris pr. md.
Not stated
Område
Copenhagen S, Copenhagen
Type
Office space
Office space in Copenhagen S, Copenhagen
 More info
Office space in Copenhagen S, Copenhagen
Office space for rent in Copenhagen S, Copenhagen
Areal
Ca. 565 m2
Pris pr. md.
Not stated
Område
Copenhagen S, Copenhagen
Type
Office space
Office space in Copenhagen S, Copenhagen
 More info
Office space in Copenhagen S, Copenhagen
Office space for rent in Copenhagen S, Copenhagen
Areal
-
Pris pr. md.
Not stated
Område
Copenhagen S, Copenhagen
Type
Office space
Office space in Copenhagen S, Copenhagen
 More info
Office space in Copenhagen S, Copenhagen
Office space for rent in Copenhagen S, Copenhagen
Areal
Ca. 460 m2
Pris pr. md.
Ca. 57,750 DKK pr md
Område
Copenhagen S, Copenhagen
Type
Office space
Office space in Copenhagen S, Copenhagen
 More info
Office space in Copenhagen S, Copenhagen
Office space for rent in Copenhagen S, Copenhagen
Areal
Ca. 2,510 m2
Pris pr. md.
Ca. 313,750 DKK pr md
Område
Copenhagen S, Copenhagen
Type
Office space
Office space in Copenhagen S, Copenhagen
 More info
Office space in Copenhagen S, Copenhagen
Office space for rent in Copenhagen S, Copenhagen
Areal
-
Pris pr. md.
Not stated
Område
Copenhagen S, Copenhagen
Type
Office space
Office space in Copenhagen S, Copenhagen
 More info
Office space in Copenhagen S, Copenhagen
Office space for rent in Copenhagen S, Copenhagen
Areal
Ca. 270 m2
Pris pr. md.
Ca. 31,600 DKK pr md
Område
Copenhagen S, Copenhagen
Type
Office space
Office space in Copenhagen S, Copenhagen
 More info
Office space in Copenhagen S, Copenhagen
Office space for rent in Copenhagen S, Copenhagen
Areal
Ca. 1,455 m2
Pris pr. md.
Ca. 187,800 DKK pr md
Område
Copenhagen S, Copenhagen
Type
Office space
Office space in Copenhagen S, Copenhagen
 More info
Office space in Copenhagen S, Copenhagen
Office space for rent in Copenhagen S, Copenhagen
Areal
Ca. 1,560 m2
Pris pr. md.
Ca. 201,500 DKK pr md
Område
Copenhagen S, Copenhagen
Type
Office space
Office space in Dragør, Copenhagen
 More info
Office space in Dragør, Copenhagen
Office space for rent in Dragør, Copenhagen
Areal
Ca. 25 m2
Pris pr. md.
Not stated
Område
Dragør, Copenhagen
Type
Office space
Office space in Copenhagen S, Copenhagen
 More info
Office space in Copenhagen S, Copenhagen
Office space for rent in Copenhagen S, Copenhagen
Areal
Ca. 1,930 m2
Pris pr. md.
Ca. 241,400 DKK pr md
Område
Copenhagen S, Copenhagen
Type
Office space
Selected customers
30,000 customers use Companyspace.com
30,000 customers
285,000 companies in our database
2,400 rentals annually
Companyspace.com is used by thousands of landlords, property companies, commercial real estate agents, investors and business centres seeking greater visibility, more enquiries and lower vacancy rates.


