


Commercial premises for rent in Viby J
There are 69 available commercial properties in Viby J right now. Companyspace.com collects commercial properties from many different parts of the market, so that you as a company can more easily get an overview of available commercial properties in Viby J.
Companyspace.com today:
New today 713
Updated 24h 1,298
Notifications about new companyspaces1,367
Copenhagen +2
Stockholm +1
Vienna +19
Paris +6
Madrid +13
Dublin (county) +54
Warsaw +4
Greater London +8
Latest update 29 min ago
Active ads 361,040
69 company spaces found
Warehouse in Viby J, Aarhus
More info

Warehouse in Viby J, Aarhus
Warehouse for rent in Viby J, Aarhus
Areal
50 m2
Pris pr. md.
Not stated
Område
Viby J, Aarhus
Type
Warehouse
Warehouse in Viby J, Aarhus
 More info
Warehouse in Viby J, Aarhus
Warehouse for rent in Viby J, Aarhus
Areal
170 m2
Pris pr. md.
7,083 DKK pr md
Område
Viby J, Aarhus
Type
Warehouse
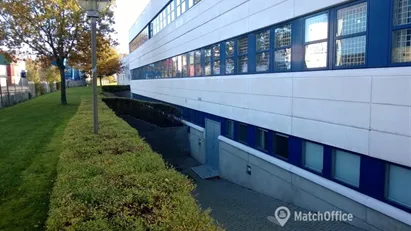
Office space in Viby J, Aarhus

 More info
Office space in Viby J, Aarhus
Office space for rent in Viby J, Aarhus
Areal
466 m2
Pris pr. md.
46,600 DKK pr md
Område
Viby J, Aarhus
Type
Office space
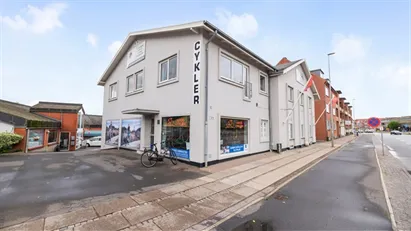
Showroom in Viby J, Aarhus
 More info
Showroom in Viby J, Aarhus
Showroom for rent in Viby J, Aarhus
Areal
Ca. 75 m2
Pris pr. md.
Ca. 900 DKK pr md
Område
Viby J, Aarhus
Type
Showroom
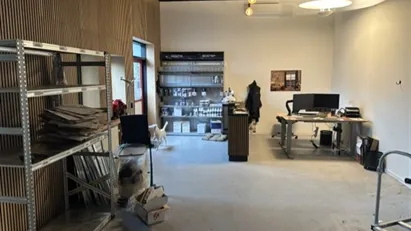
Office space in Viby J, Aarhus
 More info
Office space in Viby J, Aarhus
Office space for rent in Viby J, Aarhus
Areal
10 - 500 m2
Pris pr. md.
Not stated
Område
Viby J, Aarhus
Type
Office space
Showroom in Viby J, Aarhus
 More info
Showroom in Viby J, Aarhus
Showroom for rent in Viby J, Aarhus
Areal
Ca. 75 m2
Pris pr. md.
Ca. 900 DKK pr md
Område
Viby J, Aarhus
Type
Showroom
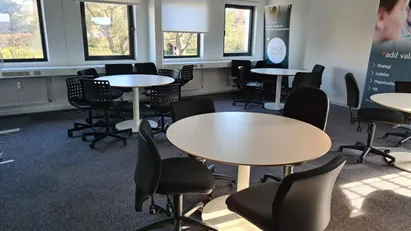
Office space in Viby J, Aarhus
 More info
Office space in Viby J, Aarhus
Office space for rent in Viby J, Aarhus
Areal
Ca. 310 m2
Pris pr. md.
Ca. 19,400 DKK pr md
Område
Viby J, Aarhus
Type
Office space
Office space in Viby J, Aarhus
More info
Office space in Viby J, Aarhus
Office space for rent in Viby J, Aarhus
Areal
Ca. 305 m2
Pris pr. md.
Ca. 23,900 DKK pr md
Område
Viby J, Aarhus
Type
Office space
Office space in Viby J, Aarhus
More info
Office space in Viby J, Aarhus
Office space for rent in Viby J, Aarhus
Areal
Ca. 390 m2
Pris pr. md.
Ca. 34,200 DKK pr md
Område
Viby J, Aarhus
Type
Office space
Office space in Viby J, Aarhus
More info
Office space in Viby J, Aarhus
Office space for rent in Viby J, Aarhus
Areal
Ca. 680 m2
Pris pr. md.
Ca. 62,450 DKK pr md
Område
Viby J, Aarhus
Type
Office space
Office space in Viby J, Aarhus
More info
Office space in Viby J, Aarhus
Office space for rent in Viby J, Aarhus
Areal
Ca. 715 m2
Pris pr. md.
Ca. 62,550 DKK pr md
Område
Viby J, Aarhus
Type
Office space
Office space in Viby J, Aarhus
More info
Office space in Viby J, Aarhus
Office space for rent in Viby J, Aarhus
Areal
Ca. 555 m2
Pris pr. md.
Ca. 48,650 DKK pr md
Område
Viby J, Aarhus
Type
Office space
Office space in Viby J, Aarhus
More info
Office space in Viby J, Aarhus
Office space for rent in Viby J, Aarhus
Areal
Ca. 235 m2
Pris pr. md.
Ca. 20,500 DKK pr md
Område
Viby J, Aarhus
Type
Office space
Office space in Viby J, Aarhus
More info
Office space in Viby J, Aarhus
Office space for rent in Viby J, Aarhus
Areal
Ca. 1,395 m2
Pris pr. md.
Ca. 125,000 DKK pr md
Område
Viby J, Aarhus
Type
Office space
Office space in Viby J, Aarhus
More info
Office space in Viby J, Aarhus
Office space for rent in Viby J, Aarhus
Areal
Ca. 235 m2
Pris pr. md.
Ca. 20,500 DKK pr md
Område
Viby J, Aarhus
Type
Office space
Office space in Viby J, Aarhus
More info
Office space in Viby J, Aarhus
Office space for rent in Viby J, Aarhus
Areal
Ca. 1,785 m2
Pris pr. md.
Ca. 158,850 DKK pr md
Område
Viby J, Aarhus
Type
Office space
Office space in Viby J, Aarhus
 More info
Office space in Viby J, Aarhus
Office space for rent in Viby J, Aarhus
Areal
Ca. 530 m2
Pris pr. md.
Ca. 44,750 DKK pr md
Område
Viby J, Aarhus
Type
Office space
Warehouse in Viby J, Aarhus
 More info
Warehouse in Viby J, Aarhus
Warehouse for rent in Viby J, Aarhus
Areal
Ca. 935 m2
Pris pr. md.
Ca. 45,400 DKK pr md
Område
Viby J, Aarhus
Type
Warehouse
Selected customers
30,000 customers use Companyspace.com
30,000 customers
285,000 companies in our database
2,400 rentals annually
Companyspace.com is used by thousands of landlords, property companies, commercial real estate agents, investors and business centres seeking greater visibility, more enquiries and lower vacancy rates.


