


Commercial premises for rentin Randers
There are 176 available commercial properties in Randers right now. Companyspace.com collects commercial properties from many different parts of the market, so that you as a company can more easily get an overview of available commercial properties in Randers.
Companyspace.com today:
New today 732
Updated 24h 1,317
Notifications about new companyspaces1,601
Copenhagen +2
Stockholm +1
Vienna +19
Paris +6
Madrid +13
Dublin (county) +54
Warsaw +4
Greater London +8
Latest update 1 h ago
Active ads 361,037
176 company spaces found
Shop in Randers C, Randers
More info
We monitor the market!
Shop in Randers C, Randers
Shop for rent in Randers C, Randers
Areal
Ca. 1,355 m2
Pris pr. md.
Ca. 65,000 DKK pr md
Område
Randers C, Randers
Type
Shop
Shop in Randers C, Randers
More info
We monitor the market!
Shop in Randers C, Randers
Shop for rent in Randers C, Randers
Areal
Ca. 100 m2
Pris pr. md.
Ca. 5,200 DKK pr md
Område
Randers C, Randers
Type
Shop
Shop in Randers C, Randers
More info
We monitor the market!
Shop in Randers C, Randers
Shop for rent in Randers C, Randers
Areal
Ca. 25 m2
Pris pr. md.
Ca. 3,000 DKK pr md
Område
Randers C, Randers
Type
Shop
Shop in Randers C, Randers
More info
We monitor the market!
Shop in Randers C, Randers
Shop for rent in Randers C, Randers
Areal
Ca. 180 m2
Pris pr. md.
Ca. 7,500 DKK pr md
Område
Randers C, Randers
Type
Shop
Shop in Randers C, Randers
More info
We monitor the market!
Shop in Randers C, Randers
Shop for rent in Randers C, Randers
Areal
Ca. 280 m2
Pris pr. md.
Ca. 35,000 DKK pr md
Område
Randers C, Randers
Type
Shop
Shop in Randers SØ, Randers
More info
We monitor the market!
Shop in Randers SØ, Randers
Shop for rent in Randers SØ, Randers
Areal
Ca. 190 m2
Pris pr. md.
Ca. 12,650 DKK pr md
Område
Randers SØ, Randers
Type
Shop
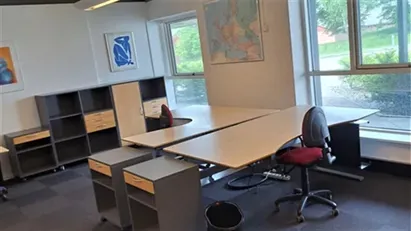
Office space in Randers NØ, Randers
More info
We monitor the market!
Office space in Randers NØ, Randers
Office space for rent in Randers NØ, Randers
Areal
Ca. 430 m2
Pris pr. md.
Ca. 10,750 DKK pr md
Område
Randers NØ, Randers
Type
Office space
Office space in Randers NØ, Randers
More info
We monitor the market!
Office space in Randers NØ, Randers
Office space for rent in Randers NØ, Randers
Areal
Ca. 215 m2
Pris pr. md.
Ca. 5,400 DKK pr md
Område
Randers NØ, Randers
Type
Office space
Shop in Randers C, Randers
More info
We monitor the market!
Shop in Randers C, Randers
Shop for rent in Randers C, Randers
Areal
Ca. 275 m2
Pris pr. md.
Ca. 16,000 DKK pr md
Område
Randers C, Randers
Type
Shop
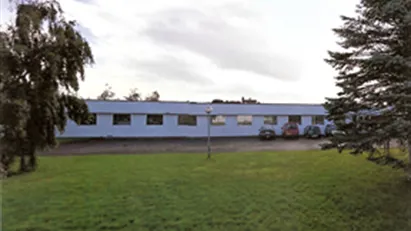
Office space in Randers NV, Randers
More info
We monitor the market!
Office space in Randers NV, Randers
Office space for rent in Randers NV, Randers
Areal
Ca. 475 m2
Pris pr. md.
Ca. 15,850 DKK pr md
Område
Randers NV, Randers
Type
Office space
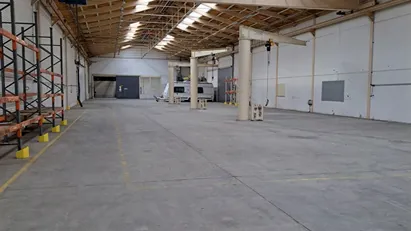
Warehouse in Randers NØ, Randers
More info
We monitor the market!
Warehouse in Randers NØ, Randers
Warehouse for rent in Randers NØ, Randers
Areal
Ca. 100 m2
Pris pr. md.
Ca. 2,600 DKK pr md
Område
Randers NØ, Randers
Type
Warehouse
Shop in Randers C, Randers
More info
We monitor the market!
Shop in Randers C, Randers
Shop for rent in Randers C, Randers
Areal
Ca. 200 m2
Pris pr. md.
Ca. 7,000 DKK pr md
Område
Randers C, Randers
Type
Shop
Shop in Randers C, Randers
More info
We monitor the market!
Shop in Randers C, Randers
Shop for rent in Randers C, Randers
Areal
Ca. 130 m2
Pris pr. md.
Ca. 15,000 DKK pr md
Område
Randers C, Randers
Type
Shop
Office space in Randers NØ, Randers
More info
We monitor the market!
Office space in Randers NØ, Randers
Office space for rent in Randers NØ, Randers
Areal
Ca. 60 m2
Pris pr. md.
Ca. 6,300 DKK pr md
Område
Randers NØ, Randers
Type
Office space
Office space in Randers NØ, Randers
 More info
Office space in Randers NØ, Randers
Office space for rent in Randers NØ, Randers
Areal
Ca. 110 m2
Pris pr. md.
Not stated
Område
Randers NØ, Randers
Type
Office space
Industrial property in Randers NØ, Randers
 More info
Industrial property in Randers NØ, Randers
Industrial property for rent in Randers NØ, Randers
Areal
10 - 400 m2
Pris pr. md.
Not stated
Område
Randers NØ, Randers
Type
Industrial property
Warehouse in Randers NV, Randers
 More info
Warehouse in Randers NV, Randers
Warehouse for rent in Randers NV, Randers
Areal
Ca. 500 m2
Pris pr. md.
Not stated
Område
Randers NV, Randers
Type
Warehouse
Office space in Randers SØ, Randers
 More info
Office space in Randers SØ, Randers
Office space for rent in Randers SØ, Randers
Areal
Ca. 930 m2
Pris pr. md.
Not stated
Område
Randers SØ, Randers
Type
Office space
Selected customers
30,000 customers use Companyspace.com
30,000 customers
285,000 companies in our database
2,400 rentals annually
Companyspace.com is used by thousands of landlords, property companies, commercial real estate agents, investors and business centres seeking greater visibility, more enquiries and lower vacancy rates.


