


Commercial premises for rent in Denmark
There are 12,710 available commercial properties in Denmark right now. Companyspace.com collects commercial properties from many different parts of the market, so that you as a company can more easily get an overview of available commercial properties in Denmark.
Companyspace.com today:
New today 735
Updated 24h 1,317
Notifications about new companyspaces1,911
Copenhagen +2
Stockholm +1
Vienna +19
Paris +6
Madrid +13
Dublin (county) +54
Warsaw +4
Greater London +8
Latest update 9 min ago
Active ads 361,692
12,710 company spaces found
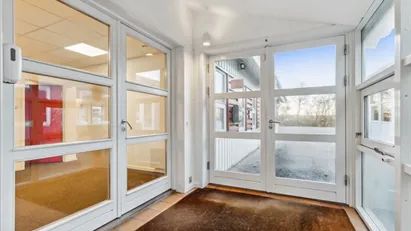
Warehouse in Ishøj, Greater Copenhagen
 More info
Warehouse in Ishøj, Greater Copenhagen
Warehouse for rent in Ishøj, Greater Copenhagen
Areal
Ca. 590 m2
Pris pr. md.
Ca. 36,250 DKK pr md
Område
Ishøj, Greater Copenhagen
Type
Warehouse
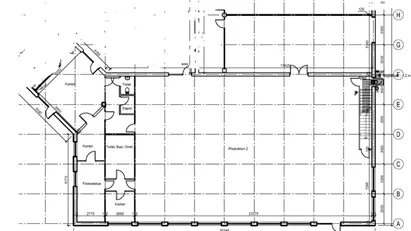
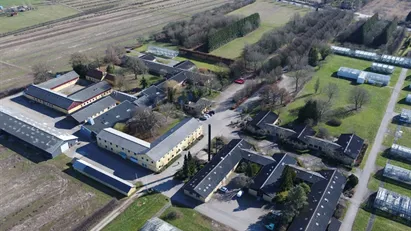
Office space in Årslev, Funen
 More info
Office space in Årslev, Funen
Office space for rent in Årslev, Funen
Areal
350 - 11,000 m2
Pris pr. md.
Ca. 183,350 DKK pr md
Område
Årslev, Funen
Type
Office space
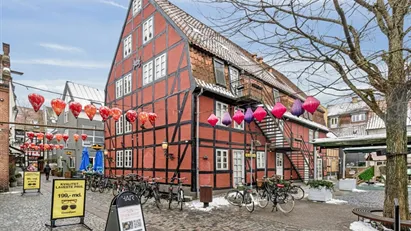
Commercial space in Odense C, Odense
 More info
Commercial space in Odense C, Odense
Commercial space for rent in Odense C, Odense
Areal
Ca. 510 m2
Pris pr. md.
Ca. 75,000 DKK pr md
Område
Odense C, Odense
Type
Commercial property
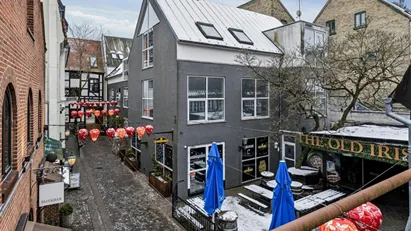
Shop in Odense C, Odense
 More info
Shop in Odense C, Odense
Shop for rent in Odense C, Odense
Areal
Ca. 85 m2
Pris pr. md.
Ca. 12,750 DKK pr md
Område
Odense C, Odense
Type
Shop
Warehouse in Tilst, Aarhus
 More info
Warehouse in Tilst, Aarhus
Warehouse for rent in Tilst, Aarhus
Areal
Ca. 525 m2
Pris pr. md.
Not stated
Område
Tilst, Aarhus
Type
Warehouse
Warehouse in Nørresundby, North Jutland Region
 More info
Warehouse in Nørresundby, North Jutland Region
Warehouse for rent in Nørresundby, North Jutland Region
Areal
Ca. 440 m2
Pris pr. md.
Not stated
Område
Nørresundby, North Jutland Region
Type
Warehouse
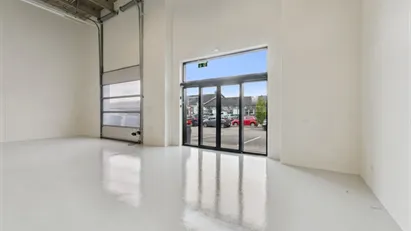
Commercial space in Odense C, Odense
 More info
Commercial space in Odense C, Odense
Commercial space for rent in Odense C, Odense
Areal
Ca. 265 m2
Pris pr. md.
Ca. 27,500 DKK pr md
Område
Odense C, Odense
Type
Commercial property
Warehouse in Sønderborg, Region of Southern Denmark
 More info
Warehouse in Sønderborg, Region of Southern Denmark
Warehouse for rent in Sønderborg, Region of Southern Denmark
Areal
Ca. 220 m2
Pris pr. md.
Not stated
Område
Sønderborg, Region of Southern Denmark
Type
Warehouse
Shop in Aalborg, Aalborg (region)
 More info
Shop in Aalborg, Aalborg (region)
Shop for rent in Aalborg, Aalborg (region)
Areal
Ca. 490 m2
Pris pr. md.
Not stated
Område
Aalborg, Aalborg (region)
Type
Shop
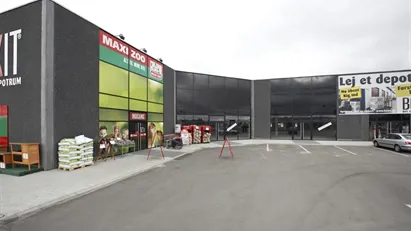
Shop in Hjørring, North Jutland Region
 More info
Shop in Hjørring, North Jutland Region
Shop for rent in Hjørring, North Jutland Region
Areal
Ca. 935 m2
Pris pr. md.
Not stated
Område
Hjørring, North Jutland Region
Type
Shop
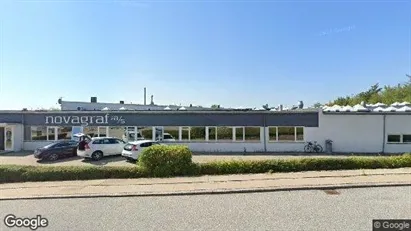
Warehouse in Aarhus N, Aarhus
 More info
Warehouse in Aarhus N, Aarhus
Warehouse for rent in Aarhus N, Aarhus
Areal
Ca. 595 m2
Pris pr. md.
Not stated
Område
Aarhus N, Aarhus
Type
Warehouse
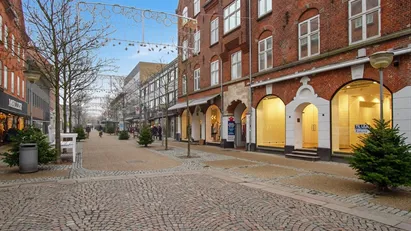
Shop in Hjørring, North Jutland Region
 More info
Shop in Hjørring, North Jutland Region
Shop for rent in Hjørring, North Jutland Region
Areal
Ca. 605 m2
Pris pr. md.
Not stated
Område
Hjørring, North Jutland Region
Type
Shop
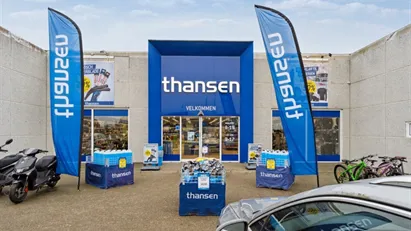
Shop in Augustenborg, Region of Southern Denmark
 More info
Shop in Augustenborg, Region of Southern Denmark
Shop for rent in Augustenborg, Region of Southern Denmark
Areal
Ca. 815 m2
Pris pr. md.
Not stated
Område
Augustenborg, Region of Southern Denmark
Type
Shop
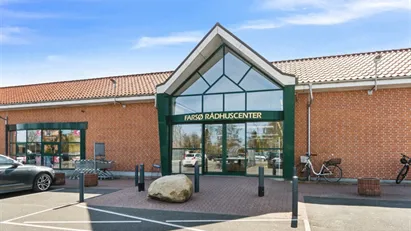
Shop in Farsø, North Jutland Region
 More info
Shop in Farsø, North Jutland Region
Shop for rent in Farsø, North Jutland Region
Areal
Ca. 365 m2
Pris pr. md.
Not stated
Område
Farsø, North Jutland Region
Type
Shop
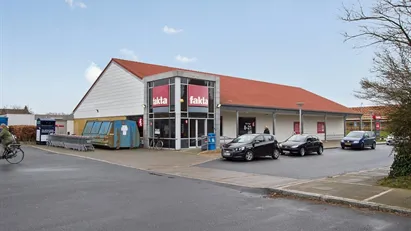
Shop in Hjørring, North Jutland Region
 More info
Shop in Hjørring, North Jutland Region
Shop for rent in Hjørring, North Jutland Region
Areal
Ca. 640 m2
Pris pr. md.
Not stated
Område
Hjørring, North Jutland Region
Type
Shop
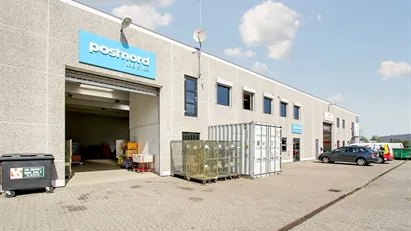
Warehouse in Aalborg, Aalborg (region)
 More info
Warehouse in Aalborg, Aalborg (region)
Warehouse for rent in Aalborg, Aalborg (region)
Areal
Ca. 2,335 m2
Pris pr. md.
Ca. 91,350 DKK pr md
Område
Aalborg, Aalborg (region)
Type
Warehouse
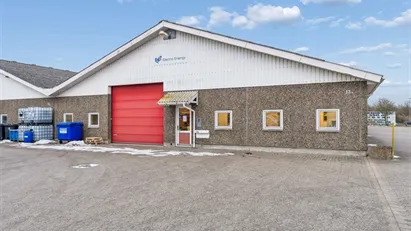
Warehouse in Holstebro, Central Jutland Region
 More info
Warehouse in Holstebro, Central Jutland Region
Warehouse for rent in Holstebro, Central Jutland Region
Areal
Ca. 1,440 m2
Pris pr. md.
Ca. 26,350 DKK pr md
Område
Holstebro, Central Jutland Region
Type
Warehouse
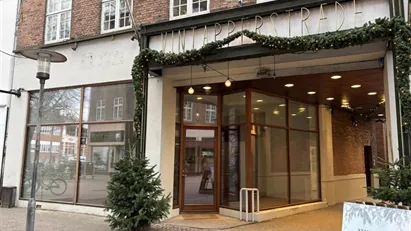
Shop in Ringsted, Region Zealand
More info
We monitor the market!
Shop in Ringsted, Region Zealand
Shop for rent in Ringsted, Region Zealand
Areal
Ca. 250 m2
Pris pr. md.
Ca. 19,650 DKK pr md
Område
Ringsted, Region Zealand
Type
Shop
Selected customers
30,000 customers use Companyspace.com
30,000 customers
285,000 companies in our database
2,400 rentals annually
Companyspace.com is used by thousands of landlords, property companies, commercial real estate agents, investors and business centres seeking greater visibility, more enquiries and lower vacancy rates.


