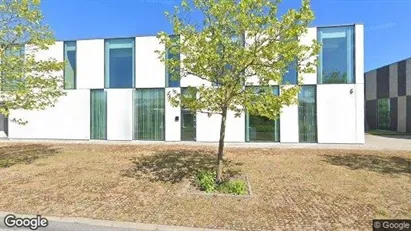
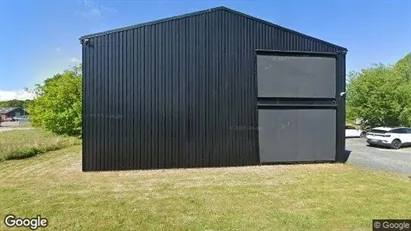
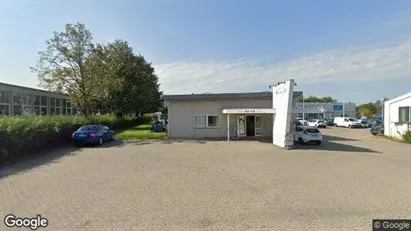
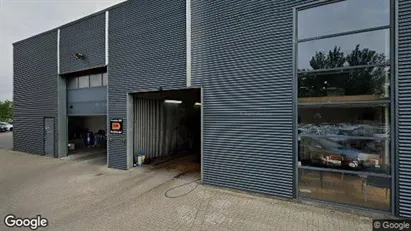
Commercial rentals in Odense S
-
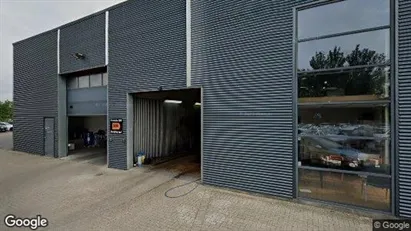
Ca. 3,815 m2 warehouse for rent in Odense S, Odense
- Ca. 166,050 DKK per month
- Ca. 500 DKK /m2/year
-
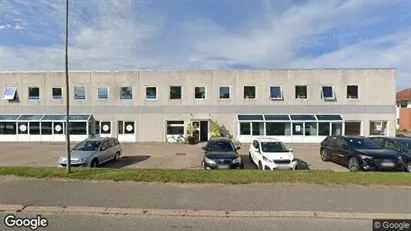
Ca. 125 m2 office space for rent in Odense S, Odense
- Ca. 7,950 DKK per month
- Ca. 750 DKK /m2/year
-
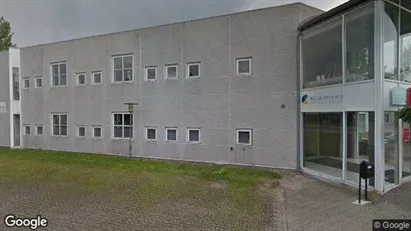
Ca. 155 m2 office space for rent in Odense S, Odense
- Ca. 10,450 DKK per month
- Ca. 800 DKK /m2/year
-
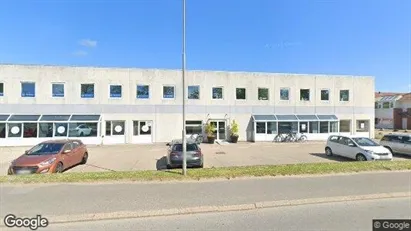
Ca. 610 m2 office space for rent in Odense S, Odense
- Ca. 33,900 DKK per month
- Ca. 650 DKK /m2/year
-
Ca. 110 m2 office space for rent in Odense S, Odense
- Ca. 5,500 DKK per month
- Ca. 600 DKK /m2/year
-
Ca. 140 m2 office space for rent in Odense S, Odense
- Ca. 8,200 DKK per month
- Ca. 700 DKK /m2/year
-
Ca. 260 m2 office space for rent in Odense S, Odense
- Ca. 18,300 DKK per month
- Ca. 850 DKK /m2/year
-
Ca. 2,475 m2 office space for rent in Odense S, Odense
- Ca. 2,458,350 DKK per month
- Ca. 11,900 DKK /m2/year
-
Ca. 185 m2 office space for rent in Odense S, Odense
- Ca. 13,100 DKK per month
- Ca. 850 DKK /m2/year
-
Ca. 1,065 m2 warehouse for rent in Odense S, Odense
- Ca. 566,650 DKK per month
- Ca. 6,350 DKK /m2/year
-
Ca. 2,475 m2 office space for rent in Odense S, Odense
- Ca. 159,400 DKK per month
- Ca. 750 DKK /m2/year
-
Ca. 505 m2 warehouse for rent in Odense S, Odense
- Ca. 26,100 DKK per month
- Ca. 600 DKK /m2/year
-
Ca. 2,540 m2 warehouse for rent in Odense S, Odense
- Ca. 94,750 DKK per month
- Ca. 450 DKK /m2/year
-
Ca. 750 m2 warehouse for rent in Odense S, Odense
- Ca. 40,650 DKK per month
- Ca. 650 DKK /m2/year
-
Ca. 375 m2 office space for rent in Odense S, Odense
- Ca. 20,250 DKK per month
- Ca. 650 DKK /m2/year
-
Ca. 565 m2 warehouse for rent in Odense S, Odense
- Ca. 20,250 DKK per month
- Ca. 450 DKK /m2/year
-
Ca. 1,220 m2 warehouse for rent in Odense S, Odense
- Ca. 51,150 DKK per month
- Ca. 500 DKK /m2/year
-
Ca. 130 m2 office space for rent in Odense S, Odense
- Ca. 6,000 DKK per month
- Ca. 550 DKK /m2/year
Frequently asked questions
Statistics on the development of available commercial real estate for rent in Odense S over the past month
Below you can see the development of available commercial real estate for rent in Odense S over the past month. In the first column you see the date. In the second column you see the total amount of commercial real estate for rent in Odense S on the date. In the third column you see the amount of new commercial real estate in Odense S that was available for rent on the date. In the fourth column you see the amount of commercial real estate in Odense S that was rented on the date. Also see aggregate statistics on all available commercial rentals in Odense S over time, aggregate statistics on new commercial rentals in Odense S over time, aggregate statistics on rented commercial real estate in Odense S over time
| Date | All commercial real estate for rent | New commercial real estate for rent | Rented out commercial real estate |
|---|---|---|---|
| 5. February 2026 | 100 | 0 | 0 |
| 4. February 2026 | 100 | 4 | 0 |
| 3. February 2026 | 96 | 0 | 4 |
| 2. February 2026 | 100 | 5 | 0 |
| 1. February 2026 | 95 | 0 | 5 |
| 31. January 2026 | 100 | 0 | 0 |
| 30. January 2026 | 100 | 1 | 0 |
| 29. January 2026 | 99 | 0 | 1 |
| 28. January 2026 | 100 | 2 | 0 |
| 27. January 2026 | 98 | 1 | 3 |
| 26. January 2026 | 100 | 0 | 1 |
| 25. January 2026 | 101 | 1 | 0 |
| 24. January 2026 | 100 | 0 | 0 |
| 23. January 2026 | 100 | 1 | 0 |
| 22. January 2026 | 99 | 4 | 0 |
| 21. January 2026 | 95 | 0 | 3 |
| 20. January 2026 | 98 | 0 | 1 |
| 19. January 2026 | 99 | 0 | 0 |
| 18. January 2026 | 99 | 0 | 0 |
| 17. January 2026 | 99 | 0 | 0 |
| 16. January 2026 | 99 | 13 | 13 |
| 15. January 2026 | 99 | 14 | 1 |
| 14. January 2026 | 86 | 6 | 1 |
| 13. January 2026 | 81 | 1 | 1 |
| 12. January 2026 | 81 | 1 | 0 |
| 11. January 2026 | 80 | 0 | 1 |
| 10. January 2026 | 81 | 1 | 0 |
| 9. January 2026 | 80 | 0 | 1 |
| 8. January 2026 | 81 | 0 | 1 |
| 7. January 2026 | 82 | 1 | 0 |
| 6. January 2026 | 81 | 0 | 0 |
Statistics on currently available commercial spaces for rent in Odense S in Denmark
In the table below, you see a series of data about available commercial space to rent in Odense S.Also see gathered statistics of all available commercial space in Odense S over time, the gathered statistics of new commercial space in Odense S over time, the gathered statistics of rented commercial space in Odense S over time
| Total | |
|---|---|
| Available premises | 75 |
| New premises since yesterday | 0 |
| Rented out premises since yesterday | 0 |
| Total available m2 | 80,882 |
| Average price per m2 per year without expenses | 121 |
| Highest price per m2 per year | 1,596 |
| Lowest price per m2 per year | 40 |


