


Commercial premises for rent in Herlev
There are 202 available commercial properties in Herlev right now. Companyspace.com collects commercial properties from many different parts of the market, so that you as a company can more easily get an overview of available commercial properties in Herlev.
Companyspace.com today:
New today 179
Updated 24h 1,023
Notifications about new companyspaces23
Copenhagen +5
Amsterdam +1
Brussels +1
Vienna +1
Warsaw +1
Roma (region) +1
Latest update 1 min ago
Active ads 364,151
202 company spaces found
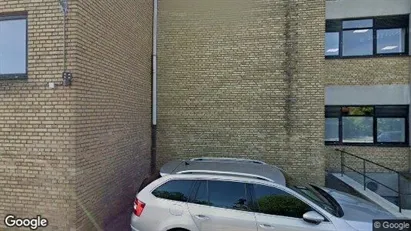
Warehouse in Herlev, Greater Copenhagen
 More info
Warehouse in Herlev, Greater Copenhagen
Warehouse for rent in Herlev, Greater Copenhagen
Areal
Ca. 410 m2
Pris pr. md.
Not stated
Område
Herlev, Greater Copenhagen
Type
Warehouse
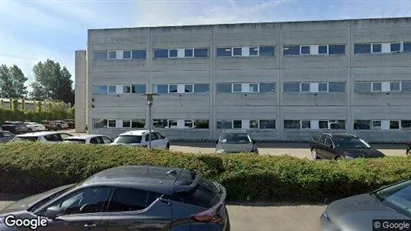
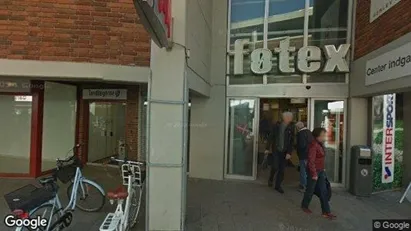
Office space in Herlev, Greater Copenhagen
 More info
Office space in Herlev, Greater Copenhagen
Office space for rent in Herlev, Greater Copenhagen
Areal
Ca. 1,750 m2
Pris pr. md.
Not stated
Område
Herlev, Greater Copenhagen
Type
Office space
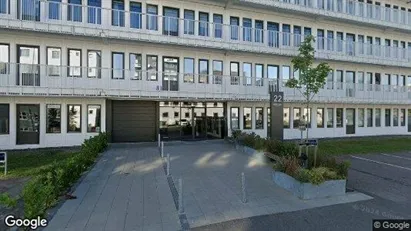
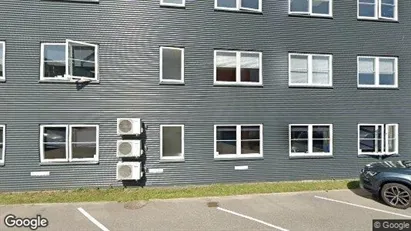
Office space in Herlev, Greater Copenhagen
 More info
Office space in Herlev, Greater Copenhagen
Office space for rent in Herlev, Greater Copenhagen
Areal
Ca. 970 m2
Pris pr. md.
Not stated
Område
Herlev, Greater Copenhagen
Type
Office space
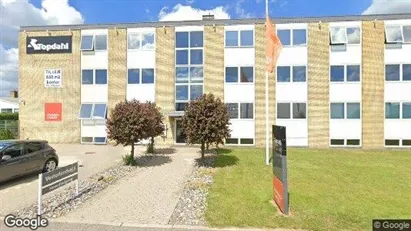
Office space in Herlev, Greater Copenhagen
 More info
Office space in Herlev, Greater Copenhagen
Office space for rent in Herlev, Greater Copenhagen
Areal
Ca. 390 m2
Pris pr. md.
Not stated
Område
Herlev, Greater Copenhagen
Type
Office space
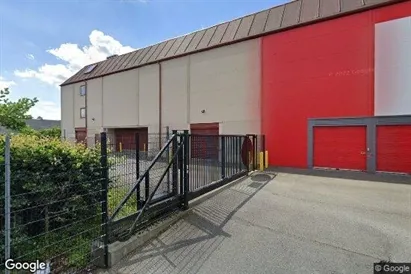
Warehouse in Herlev, Greater Copenhagen
 More info
Warehouse in Herlev, Greater Copenhagen
Warehouse for rent in Herlev, Greater Copenhagen
Areal
Ca. 1,850 m2
Pris pr. md.
Not stated
Område
Herlev, Greater Copenhagen
Type
Warehouse
Office space in Herlev, Greater Copenhagen
 More info
Office space in Herlev, Greater Copenhagen
Office space for rent in Herlev, Greater Copenhagen
Areal
Ca. 2,595 m2
Pris pr. md.
Not stated
Område
Herlev, Greater Copenhagen
Type
Office space
Office space in Herlev, Greater Copenhagen
 More info
Office space in Herlev, Greater Copenhagen
Office space for rent in Herlev, Greater Copenhagen
Areal
Ca. 900 m2
Pris pr. md.
Not stated
Område
Herlev, Greater Copenhagen
Type
Office space
Office space in Herlev, Greater Copenhagen
 More info
Office space in Herlev, Greater Copenhagen
Office space for rent in Herlev, Greater Copenhagen
Areal
-
Pris pr. md.
Not stated
Område
Herlev, Greater Copenhagen
Type
Office space
Office space in Herlev, Greater Copenhagen
 More info
Office space in Herlev, Greater Copenhagen
Office space for rent in Herlev, Greater Copenhagen
Areal
Ca. 1,940 m2
Pris pr. md.
Not stated
Område
Herlev, Greater Copenhagen
Type
Office space
Warehouse in Herlev, Greater Copenhagen
 More info
Warehouse in Herlev, Greater Copenhagen
Warehouse for rent in Herlev, Greater Copenhagen
Areal
1 - 15 m2
Pris pr. md.
Not stated
Område
Herlev, Greater Copenhagen
Type
Warehouse
Office space in Herlev, Greater Copenhagen
 More info
Office space in Herlev, Greater Copenhagen
Office space for rent in Herlev, Greater Copenhagen
Areal
Ca. 160 m2
Pris pr. md.
Not stated
Område
Herlev, Greater Copenhagen
Type
Office space
Office space in Herlev, Greater Copenhagen
 More info
Office space in Herlev, Greater Copenhagen
Office space for rent in Herlev, Greater Copenhagen
Areal
Ca. 340 m2
Pris pr. md.
Not stated
Område
Herlev, Greater Copenhagen
Type
Office space
Office space in Herlev, Greater Copenhagen
 More info
Office space in Herlev, Greater Copenhagen
Office space for rent in Herlev, Greater Copenhagen
Areal
20 - 100 m2
Pris pr. md.
Not stated
Område
Herlev, Greater Copenhagen
Type
Office space
Commercial space in Herlev, Greater Copenhagen
 More info
Commercial space in Herlev, Greater Copenhagen
Commercial space for rent in Herlev, Greater Copenhagen
Areal
-
Pris pr. md.
Not stated
Område
Herlev, Greater Copenhagen
Type
Commercial property
Clinic in Herlev, Greater Copenhagen
 More info
Clinic in Herlev, Greater Copenhagen
Clinic for rent in Herlev, Greater Copenhagen
Areal
Ca. 70 m2
Pris pr. md.
Not stated
Område
Herlev, Greater Copenhagen
Type
Clinic
Coworking space in Herlev, Greater Copenhagen
 More info
Coworking space in Herlev, Greater Copenhagen
Coworking space for rent in Herlev, Greater Copenhagen
Areal
1 - 24 locations
Pris pr. md.
Not stated
Område
Herlev, Greater Copenhagen
Type
Coworking space
Commercial space in Herlev, Greater Copenhagen
 More info
Commercial space in Herlev, Greater Copenhagen
Commercial space for rent in Herlev, Greater Copenhagen
Areal
-
Pris pr. md.
Not stated
Område
Herlev, Greater Copenhagen
Type
Commercial property
Commercial space in Herlev, Greater Copenhagen
 More info
Commercial space in Herlev, Greater Copenhagen
Commercial space for rent in Herlev, Greater Copenhagen
Areal
-
Pris pr. md.
Not stated
Område
Herlev, Greater Copenhagen
Type
Commercial property
Selected customers
Selected customers
30,000 customers use Companyspace.com
30,000 customers
285,000 companies in our database
2,400 rentals annually
Companyspace.com is used by thousands of landlords, property companies, commercial real estate agents, investors and business centres seeking greater visibility, more enquiries and lower vacancy rates.


