


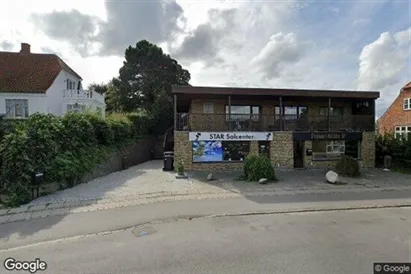
Commercial premises for rent in Helsingør
There are 89 available commercial properties in Helsingør right now. Companyspace.com collects commercial properties from many different parts of the market, so that you as a company can more easily get an overview of available commercial properties in Helsingør.
Companyspace.com today:
New today 796
Updated 24h 1,349
Notifications about new companyspaces1,596
Copenhagen +1
Stockholm +1
Amsterdam +11
Berlin +2
Brussels +5
Vienna +16
Dublin (county) +29
Warsaw +4
Lisbon +1
Latest update 33 min ago
Active ads 368,551
89 company spaces found
Clinic in Helsingør, North Zealand
 More info
Clinic in Helsingør, North Zealand
Clinic for rent in Helsingør, North Zealand
Areal
Ca. 280 m2
Pris pr. md.
Not stated
Område
Helsingør, North Zealand
Type
Clinic
Clinic in Helsingør, North Zealand
 More info
Clinic in Helsingør, North Zealand
Clinic for rent in Helsingør, North Zealand
Areal
Ca. 280 m2
Pris pr. md.
Not stated
Område
Helsingør, North Zealand
Type
Clinic
Clinic in Helsingør, North Zealand
 More info
Clinic in Helsingør, North Zealand
Clinic for rent in Helsingør, North Zealand
Areal
Ca. 10 m2
Pris pr. md.
Not stated
Område
Helsingør, North Zealand
Type
Clinic
Clinic in Helsingør, North Zealand
 More info
Clinic in Helsingør, North Zealand
Clinic for rent in Helsingør, North Zealand
Areal
Ca. 160 m2
Pris pr. md.
Not stated
Område
Helsingør, North Zealand
Type
Clinic
Clinic in Helsingør, North Zealand
 More info
Clinic in Helsingør, North Zealand
Clinic for rent in Helsingør, North Zealand
Areal
Ca. 215 m2
Pris pr. md.
Not stated
Område
Helsingør, North Zealand
Type
Clinic
Warehouse in Helsingør, North Zealand
 More info
Warehouse in Helsingør, North Zealand
Warehouse for rent in Helsingør, North Zealand
Areal
Ca. 20 m2
Pris pr. md.
Not stated
Område
Helsingør, North Zealand
Type
Warehouse
Clinic in Helsingør, North Zealand
 More info
Clinic in Helsingør, North Zealand
Clinic for rent in Helsingør, North Zealand
Areal
Ca. 160 m2
Pris pr. md.
Not stated
Område
Helsingør, North Zealand
Type
Clinic
Warehouse in Helsingør, North Zealand
 More info
Warehouse in Helsingør, North Zealand
Warehouse for rent in Helsingør, North Zealand
Areal
Ca. 20 m2
Pris pr. md.
Not stated
Område
Helsingør, North Zealand
Type
Warehouse
Clinic in Helsingør, North Zealand
 More info
Clinic in Helsingør, North Zealand
Clinic for rent in Helsingør, North Zealand
Areal
Ca. 10 m2
Pris pr. md.
Not stated
Område
Helsingør, North Zealand
Type
Clinic
Restaurant in Helsingør, North Zealand
More info
We monitor the market!
Restaurant in Helsingør, North Zealand
Restaurant for rent in Helsingør, North Zealand
Areal
-
Pris pr. md.
Not stated
Område
Helsingør, North Zealand
Type
Restaurant
Shop in Helsingør, North Zealand
More info
We monitor the market!
Shop in Helsingør, North Zealand
Shop for rent in Helsingør, North Zealand
Areal
Ca. 110 m2
Pris pr. md.
Not stated
Område
Helsingør, North Zealand
Type
Shop
Shop in Helsingør, North Zealand
More info
We monitor the market!
Shop in Helsingør, North Zealand
Shop for rent in Helsingør, North Zealand
Areal
Ca. 30 m2
Pris pr. md.
Not stated
Område
Helsingør, North Zealand
Type
Shop
Shop in Helsingør, North Zealand
More info
We monitor the market!
Shop in Helsingør, North Zealand
Shop for rent in Helsingør, North Zealand
Areal
Ca. 60 m2
Pris pr. md.
Not stated
Område
Helsingør, North Zealand
Type
Shop
Shop in Helsingør, North Zealand
More info
We monitor the market!
Shop in Helsingør, North Zealand
Shop for rent in Helsingør, North Zealand
Areal
Ca. 1,500 m2
Pris pr. md.
Not stated
Område
Helsingør, North Zealand
Type
Shop
Shop in Helsingør, North Zealand
More info
We monitor the market!
Shop in Helsingør, North Zealand
Shop for rent in Helsingør, North Zealand
Areal
Ca. 205 m2
Pris pr. md.
Not stated
Område
Helsingør, North Zealand
Type
Shop
Office space in Helsingør, North Zealand
More info
We monitor the market!
Office space in Helsingør, North Zealand
Office space for rent in Helsingør, North Zealand
Areal
Ca. 475 m2
Pris pr. md.
Not stated
Område
Helsingør, North Zealand
Type
Office space
Restaurant in Helsingør, North Zealand
More info
We monitor the market!
Restaurant in Helsingør, North Zealand
Restaurant for rent in Helsingør, North Zealand
Areal
Ca. 1,240 m2
Pris pr. md.
Not stated
Område
Helsingør, North Zealand
Type
Restaurant
Selected customers
30,000 customers use Companyspace.com
30,000 customers
285,000 companies in our database
2,400 rentals annually
Companyspace.com is used by thousands of landlords, property companies, commercial real estate agents, investors and business centres seeking greater visibility, more enquiries and lower vacancy rates.


