


Commercial premises for rent in Esbjerg
There are 171 available commercial properties in Esbjerg right now. Companyspace.com collects commercial properties from many different parts of the market, so that you as a company can more easily get an overview of available commercial properties in Esbjerg.
Companyspace.com today:
New today 2
Updated 24h 1,124
Notifications about new companyspaces1
Latest update 1 h ago
Active ads 365,800
171 company spaces found
Commercial space in Esbjerg, Esbjerg (region)
 More info
Commercial space in Esbjerg, Esbjerg (region)
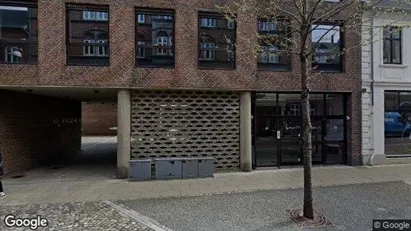
Commercial space for rent in Esbjerg, Esbjerg (region)
Areal
Ca. 60 m2
Pris pr. md.
Ca. 6,300 DKK pr md
Område
Esbjerg, Esbjerg (region)
Type
Commercial property
Commercial space in Esbjerg, Esbjerg (region)
 More info
Commercial space in Esbjerg, Esbjerg (region)
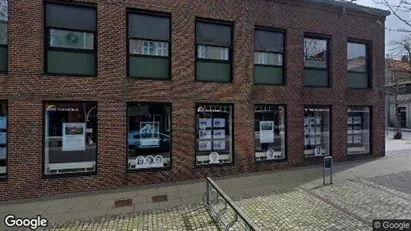
Commercial space for rent in Esbjerg, Esbjerg (region)
Areal
Ca. 75 m2
Pris pr. md.
Ca. 6,300 DKK pr md
Område
Esbjerg, Esbjerg (region)
Type
Commercial property
Office space in Esbjerg, Esbjerg (region)
 More info
Office space in Esbjerg, Esbjerg (region)
Office space for rent in Esbjerg, Esbjerg (region)
Areal
-
Pris pr. md.
Ca. 1,000 DKK pr md
Område
Esbjerg, Esbjerg (region)
Type
Office space
Office space in Esbjerg, Esbjerg (region)
 More info
Office space in Esbjerg, Esbjerg (region)
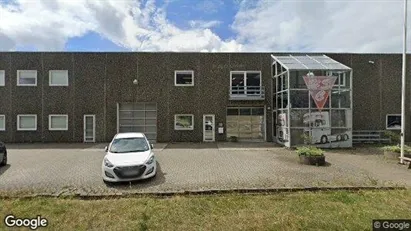
Office space for rent in Esbjerg, Esbjerg (region)
Areal
Ca. 25 m2
Pris pr. md.
Ca. 5,850 DKK pr md
Område
Esbjerg, Esbjerg (region)
Type
Office space
Clinic in Esbjerg, Esbjerg (region)
 More info
Clinic in Esbjerg, Esbjerg (region)
Clinic for rent in Esbjerg, Esbjerg (region)
Areal
Ca. 80 m2
Pris pr. md.
Ca. 6,400 DKK pr md
Område
Esbjerg, Esbjerg (region)
Type
Clinic
Office space in Esbjerg, Esbjerg (region)
 More info
Office space in Esbjerg, Esbjerg (region)
Office space for rent in Esbjerg, Esbjerg (region)
Areal
Ca. 190 m2
Pris pr. md.
Ca. 11,250 DKK pr md
Område
Esbjerg, Esbjerg (region)
Type
Office space
Office space in Esbjerg, Esbjerg (region)
 More info
Office space in Esbjerg, Esbjerg (region)
Office space for rent in Esbjerg, Esbjerg (region)
Areal
Ca. 800 m2
Pris pr. md.
Ca. 66,500 DKK pr md
Område
Esbjerg, Esbjerg (region)
Type
Office space
Office space in Esbjerg, Esbjerg (region)
 More info
Office space in Esbjerg, Esbjerg (region)
Office space for rent in Esbjerg, Esbjerg (region)
Areal
Ca. 150 m2
Pris pr. md.
Ca. 8,000 DKK pr md
Område
Esbjerg, Esbjerg (region)
Type
Office space
Office space in Esbjerg, Esbjerg (region)
 More info
Office space in Esbjerg, Esbjerg (region)
Office space for rent in Esbjerg, Esbjerg (region)
Areal
Ca. 215 m2
Pris pr. md.
Ca. 13,950 DKK pr md
Område
Esbjerg, Esbjerg (region)
Type
Office space
Warehouse in Esbjerg, Esbjerg (region)
 More info
Warehouse in Esbjerg, Esbjerg (region)
Warehouse for rent in Esbjerg, Esbjerg (region)
Areal
Ca. 375 m2
Pris pr. md.
Ca. 6,900 DKK pr md
Område
Esbjerg, Esbjerg (region)
Type
Warehouse
Office space in Esbjerg, Esbjerg (region)
 More info
Office space in Esbjerg, Esbjerg (region)
Office space for rent in Esbjerg, Esbjerg (region)
Areal
Ca. 250 m2
Pris pr. md.
Ca. 10,950 DKK pr md
Område
Esbjerg, Esbjerg (region)
Type
Office space
Office space in Esbjerg, Esbjerg (region)
 More info
Office space in Esbjerg, Esbjerg (region)
Office space for rent in Esbjerg, Esbjerg (region)
Areal
Ca. 30 m2
Pris pr. md.
Ca. 2,500 DKK pr md
Område
Esbjerg, Esbjerg (region)
Type
Office space
Office space in Esbjerg, Esbjerg (region)
 More info
Office space in Esbjerg, Esbjerg (region)
Office space for rent in Esbjerg, Esbjerg (region)
Areal
Ca. 50 m2
Pris pr. md.
Ca. 4,300 DKK pr md
Område
Esbjerg, Esbjerg (region)
Type
Office space
Office space in Esbjerg, Esbjerg (region)
 More info
Office space in Esbjerg, Esbjerg (region)
Office space for rent in Esbjerg, Esbjerg (region)
Areal
Ca. 25 m2
Pris pr. md.
Ca. 2,150 DKK pr md
Område
Esbjerg, Esbjerg (region)
Type
Office space
Office space in Esbjerg, Esbjerg (region)
 More info
Office space in Esbjerg, Esbjerg (region)
Office space for rent in Esbjerg, Esbjerg (region)
Areal
Ca. 135 m2
Pris pr. md.
Ca. 8,300 DKK pr md
Område
Esbjerg, Esbjerg (region)
Type
Office space
Shop in Esbjerg, Esbjerg (region)
 More info
Shop in Esbjerg, Esbjerg (region)
Shop for rent in Esbjerg, Esbjerg (region)
Areal
Ca. 220 m2
Pris pr. md.
Ca. 8,950 DKK pr md
Område
Esbjerg, Esbjerg (region)
Type
Shop
Shop in Esbjerg, Esbjerg (region)
More info
Shop in Esbjerg, Esbjerg (region)
Shop for rent in Esbjerg, Esbjerg (region)
Areal
Ca. 290 m2
Pris pr. md.
Ca. 41,400 DKK pr md
Område
Esbjerg, Esbjerg (region)
Type
Shop
Shop in Esbjerg, Esbjerg (region)
More info
Shop in Esbjerg, Esbjerg (region)
Shop for rent in Esbjerg, Esbjerg (region)
Areal
Ca. 400 m2
Pris pr. md.
Ca. 73,350 DKK pr md
Område
Esbjerg, Esbjerg (region)
Type
Shop
Selected customers
30,000 customers use Companyspace.com
30,000 customers
285,000 companies in our database
2,400 rentals annually
Companyspace.com is used by thousands of landlords, property companies, commercial real estate agents, investors and business centres seeking greater visibility, more enquiries and lower vacancy rates.


