


Commercial premises for rent in Bjerringbro
There are 23 available commercial properties in Bjerringbro right now. Companyspace.com collects commercial properties from many different parts of the market, so that you as a company can more easily get an overview of available commercial properties in Bjerringbro.
Companyspace.com today:
New today 399
Updated 24h 1,031
Notifications about new companyspaces41
Copenhagen +5
Amsterdam +1
Berlin +3
Brussels +2
Vienna +4
Dublin (county) +19
Warsaw +12
Roma (region) +1
Latest update 18 min ago
Active ads 364,391
23 company spaces found
Shop in Bjerringbro, Central Jutland Region
 More info
Shop in Bjerringbro, Central Jutland Region
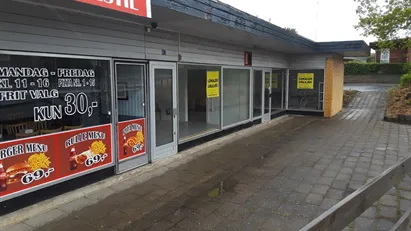
Shop for rent in Bjerringbro, Central Jutland Region
Areal
Ca. 120 m2
Pris pr. md.
Ca. 9,000 DKK per month
Område
Bjerringbro, Central Jutland Region
Type
Shop
Shop in Bjerringbro, Central Jutland Region
 More info
Shop in Bjerringbro, Central Jutland Region
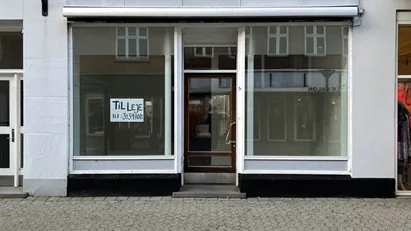
Shop for rent in Bjerringbro, Central Jutland Region
Areal
Ca. 170 m2
Pris pr. md.
Ca. 6,500 DKK per month
Område
Bjerringbro, Central Jutland Region
Type
Shop
Shop in Bjerringbro, Central Jutland Region
 More info
Shop in Bjerringbro, Central Jutland Region
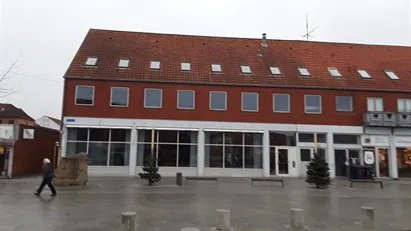
Shop for rent in Bjerringbro, Central Jutland Region
Areal
Ca. 120 m2
Pris pr. md.
Ca. 9,000 DKK per month
Område
Bjerringbro, Central Jutland Region
Type
Shop
Office space in Bjerringbro, Central Jutland Region
 More info
Office space in Bjerringbro, Central Jutland Region
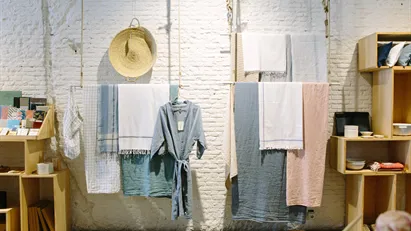
Office space for rent in Bjerringbro, Central Jutland Region
Areal
Ca. 220 m2
Pris pr. md.
Ca. 12,000 DKK per month
Område
Bjerringbro, Central Jutland Region
Type
Office space
Shop in Bjerringbro, Central Jutland Region
 More info
Shop in Bjerringbro, Central Jutland Region
Shop for rent in Bjerringbro, Central Jutland Region
Areal
Ca. 125 m2
Pris pr. md.
Ca. 4,250 DKK per month
Område
Bjerringbro, Central Jutland Region
Type
Shop
Shop in Bjerringbro, Central Jutland Region
More info
Shop in Bjerringbro, Central Jutland Region
Shop for rent in Bjerringbro, Central Jutland Region
Areal
Ca. 90 m2
Pris pr. md.
Ca. 5,900 DKK per month
Område
Bjerringbro, Central Jutland Region
Type
Shop
Restaurant in Bjerringbro, Central Jutland Region
 More info
Restaurant in Bjerringbro, Central Jutland Region
Restaurant for rent in Bjerringbro, Central Jutland Region
Areal
-
Pris pr. md.
Ca. 10,000 DKK per month
Område
Bjerringbro, Central Jutland Region
Type
Restaurant
Shop in Bjerringbro, Central Jutland Region
More info
Shop in Bjerringbro, Central Jutland Region
Shop for rent in Bjerringbro, Central Jutland Region
Areal
Ca. 90 m2
Pris pr. md.
Ca. 6,150 DKK per month
Område
Bjerringbro, Central Jutland Region
Type
Shop
Showroom in Bjerringbro, Central Jutland Region
 More info
Showroom in Bjerringbro, Central Jutland Region
Showroom for rent in Bjerringbro, Central Jutland Region
Areal
Ca. 1,530 m2
Pris pr. md.
Ca. 29,500 DKK per month
Område
Bjerringbro, Central Jutland Region
Type
Showroom
Office space in Bjerringbro, Central Jutland Region
 More info
Office space in Bjerringbro, Central Jutland Region
Office space for rent in Bjerringbro, Central Jutland Region
Areal
Ca. 220 m2
Pris pr. md.
Ca. 12,000 DKK per month
Område
Bjerringbro, Central Jutland Region
Type
Office space
Shop in Bjerringbro, Central Jutland Region
More info
Shop in Bjerringbro, Central Jutland Region
Shop for rent in Bjerringbro, Central Jutland Region
Areal
Ca. 170 m2
Pris pr. md.
Ca. 6,500 DKK per month
Område
Bjerringbro, Central Jutland Region
Type
Shop
Shop in Bjerringbro, Central Jutland Region
More info
Shop in Bjerringbro, Central Jutland Region
Shop for rent in Bjerringbro, Central Jutland Region
Areal
Ca. 120 m2
Pris pr. md.
Ca. 9,000 DKK per month
Område
Bjerringbro, Central Jutland Region
Type
Shop
Shop in Bjerringbro, Central Jutland Region
More info
Shop in Bjerringbro, Central Jutland Region
Shop for rent in Bjerringbro, Central Jutland Region
Areal
Ca. 120 m2
Pris pr. md.
Ca. 9,000 DKK per month
Område
Bjerringbro, Central Jutland Region
Type
Shop
Shop in Bjerringbro, Central Jutland Region
More info
Shop in Bjerringbro, Central Jutland Region
Shop for rent in Bjerringbro, Central Jutland Region
Areal
Ca. 250 m2
Pris pr. md.
Ca. 15,000 DKK per month
Område
Bjerringbro, Central Jutland Region
Type
Shop
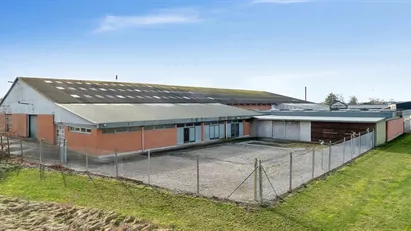
Warehouse in Bjerringbro, Central Jutland Region
 More info
Warehouse in Bjerringbro, Central Jutland Region
Warehouse for rent in Bjerringbro, Central Jutland Region
Areal
300 - 1,933 m2
Pris pr. md.
Not stated
Område
Bjerringbro, Central Jutland Region
Type
Warehouse
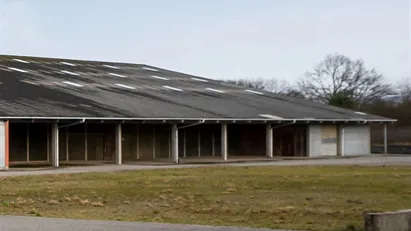
Warehouse in Bjerringbro, Central Jutland Region
 More info
Warehouse in Bjerringbro, Central Jutland Region
Warehouse for rent in Bjerringbro, Central Jutland Region
Areal
300 - 2,192 m2
Pris pr. md.
Not stated
Område
Bjerringbro, Central Jutland Region
Type
Warehouse
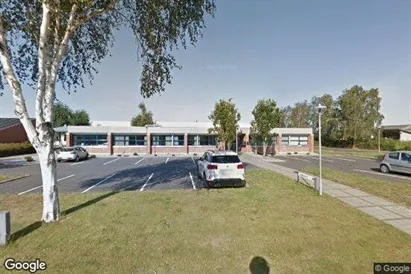
Coworking space in Bjerringbro, Central Jutland Region
 More info
Coworking space in Bjerringbro, Central Jutland Region
Coworking space for rent in Bjerringbro, Central Jutland Region
Areal
999 locations
Pris pr. md.
Not stated
Område
Bjerringbro, Central Jutland Region
Type
Coworking space
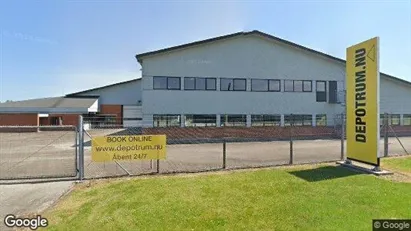
Warehouse in Bjerringbro, Central Jutland Region
 More info
Warehouse in Bjerringbro, Central Jutland Region
Warehouse for rent in Bjerringbro, Central Jutland Region
Areal
300 - 2,192 m2
Pris pr. md.
Not stated
Område
Bjerringbro, Central Jutland Region
Type
Warehouse
Selected customers
Selected customers
30,000 customers use Companyspace.com
30,000 customers
285,000 companies in our database
2,400 rentals annually
Companyspace.com is used by thousands of landlords, property companies, commercial real estate agents, investors and business centres seeking greater visibility, more enquiries and lower vacancy rates.


