


Commercial premises for rentin Amager
There are 411 available commercial properties in Amager right now. Companyspace.com collects commercial properties from many different parts of the market, so that you as a company can more easily get an overview of available commercial properties in Amager.
Companyspace.com today:
New today 79
Updated 24h 874
Vienna +2
Latest update 1 min ago
Active ads 365,790
411 company spaces found
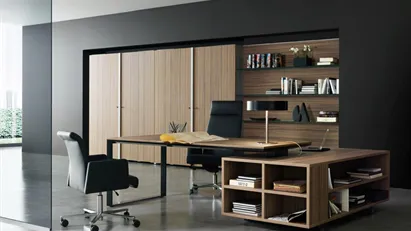
Office space in Copenhagen S, Copenhagen
 More info
Office space in Copenhagen S, Copenhagen
Office space for rent in Copenhagen S, Copenhagen
Areal
Ca. 795 m2
Pris pr. md.
Not stated
Område
Copenhagen S, Copenhagen
Type
Office space
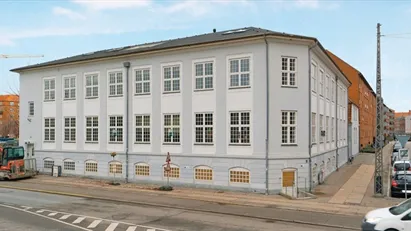
Office space in Kastrup, Copenhagen
More info
Office space in Kastrup, Copenhagen
Office space for rent in Kastrup, Copenhagen
Areal
Ca. 200 m2
Pris pr. md.
Ca. 20,850 DKK per month
Område
Kastrup, Copenhagen
Type
Office space
Garage in Copenhagen S, Copenhagen
 More info
Garage in Copenhagen S, Copenhagen
Garage for rent in Copenhagen S, Copenhagen
Areal
Ca. 10 m2
Pris pr. md.
Not stated
Område
Copenhagen S, Copenhagen
Type
Garage
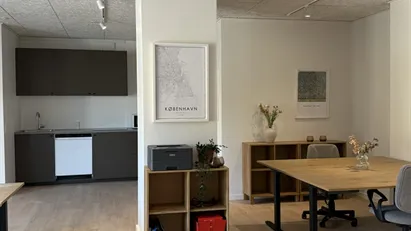
Office space in Copenhagen S, Copenhagen
More info
Office space in Copenhagen S, Copenhagen
Office space for rent in Copenhagen S, Copenhagen
Areal
Ca. 925 m2
Pris pr. md.
Not stated
Område
Copenhagen S, Copenhagen
Type
Office space
Office space in Copenhagen S, Copenhagen
More info
Office space in Copenhagen S, Copenhagen
Office space for rent in Copenhagen S, Copenhagen
Areal
Ca. 925 m2
Pris pr. md.
Not stated
Område
Copenhagen S, Copenhagen
Type
Office space
Restaurant in Copenhagen S, Copenhagen
 More info
Restaurant in Copenhagen S, Copenhagen
Restaurant for rent in Copenhagen S, Copenhagen
Areal
-
Pris pr. md.
Ca. 56,000 DKK per month
Område
Copenhagen S, Copenhagen
Type
Restaurant
Restaurant in Copenhagen S, Copenhagen
More info
Restaurant in Copenhagen S, Copenhagen
Restaurant for rent in Copenhagen S, Copenhagen
Areal
-
Pris pr. md.
Ca. 110,000 DKK per month
Område
Copenhagen S, Copenhagen
Type
Restaurant
Office space in Copenhagen S, Copenhagen
More info
Office space in Copenhagen S, Copenhagen
Office space for rent in Copenhagen S, Copenhagen
Areal
Ca. 745 m2
Pris pr. md.
Not stated
Område
Copenhagen S, Copenhagen
Type
Office space
Office space in Copenhagen S, Copenhagen
More info
Office space in Copenhagen S, Copenhagen
Office space for rent in Copenhagen S, Copenhagen
Areal
Ca. 725 m2
Pris pr. md.
Not stated
Område
Copenhagen S, Copenhagen
Type
Office space
Restaurant in Copenhagen S, Copenhagen
More info
Restaurant in Copenhagen S, Copenhagen
Restaurant for rent in Copenhagen S, Copenhagen
Areal
-
Pris pr. md.
Ca. 110,000 DKK per month
Område
Copenhagen S, Copenhagen
Type
Restaurant
Restaurant in Copenhagen S, Copenhagen
More info
Restaurant in Copenhagen S, Copenhagen
Restaurant for rent in Copenhagen S, Copenhagen
Areal
Ca. 225 m2
Pris pr. md.
Ca. 33,250 DKK per month
Område
Copenhagen S, Copenhagen
Type
Restaurant
Shop in Copenhagen S, Copenhagen
 More info
Shop in Copenhagen S, Copenhagen
Shop for rent in Copenhagen S, Copenhagen
Areal
Ca. 715 m2
Pris pr. md.
Ca. 107,250 DKK per month
Område
Copenhagen S, Copenhagen
Type
Shop
Shop in Dragør, Copenhagen
More info
Shop in Dragør, Copenhagen
Shop for rent in Dragør, Copenhagen
Areal
Ca. 75 m2
Pris pr. md.
Ca. 8,850 DKK per month
Område
Dragør, Copenhagen
Type
Shop
Coworking space in Copenhagen S, Copenhagen
 More info
Coworking space in Copenhagen S, Copenhagen
Coworking space for rent in Copenhagen S, Copenhagen
Areal
5 - 5 locations
Pris pr. md.
Not stated
Område
Copenhagen S, Copenhagen
Type
Coworking space
Office space in Kastrup, Copenhagen
 More info
Office space in Kastrup, Copenhagen
Office space for rent in Kastrup, Copenhagen
Areal
Ca. 100 m2
Pris pr. md.
Not stated
Område
Kastrup, Copenhagen
Type
Office space
Coworking space in Copenhagen S, Copenhagen
 More info
Coworking space in Copenhagen S, Copenhagen
Coworking space for rent in Copenhagen S, Copenhagen
Areal
Ca. 350 m2
Pris pr. md.
Not stated
Område
Copenhagen S, Copenhagen
Type
Coworking space
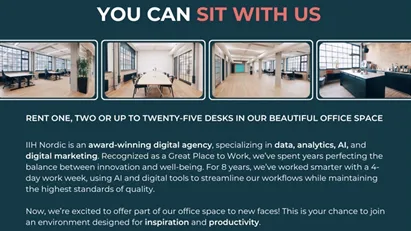
Coworking space in Copenhagen S, Copenhagen
 More info
Coworking space in Copenhagen S, Copenhagen
Coworking space for rent in Copenhagen S, Copenhagen
Areal
1 - 25 locations
Pris pr. md.
Not stated
Område
Copenhagen S, Copenhagen
Type
Coworking space
Coworking space in Copenhagen S, Copenhagen
 More info
Coworking space in Copenhagen S, Copenhagen
Coworking space for rent in Copenhagen S, Copenhagen
Areal
4 locations
Pris pr. md.
Not stated
Område
Copenhagen S, Copenhagen
Type
Coworking space
Selected customers
Selected customers
30,000 customers use Companyspace.com
30,000 customers
285,000 companies in our database
2,400 rentals annually
Companyspace.com is used by thousands of landlords, property companies, commercial real estate agents, investors and business centres seeking greater visibility, more enquiries and lower vacancy rates.


