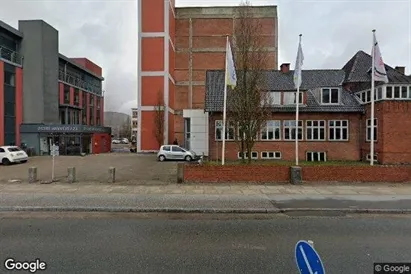
Commercial space in Svendborg
See all available business premises, commercial properties and commercial spaces in Svendborg below. If you are looking for commercial real estate, business space, a business premise or commercial space in Svendborg, you have come to the right place. We have most available commercial spaces in Svendborg in our database. Find your business premise in Svendborg here. Enjoy.
117 company spaces found
-
Ca. 660 m2 industrial property for rent in Svendborg, Funen
- Ca. 30,000 DKK per month
- Ca. 550 DKK /m2/year
-
Ca. 30 m2 commercial space for rent in Svendborg, Funen
- Ca. 2,950 DKK per month
- Ca. 1,200 DKK /m2/year
-
Ca. 55 m2 office space for rent in Svendborg, Funen
- Ca. 5,000 DKK per month
- Ca. 1,100 DKK /m2/year
-
Ca. 200 m2 office space for rent in Svendborg, Funen
- Ca. 10,000 DKK per month
- Ca. 600 DKK /m2/year
-
Ca. 660 m2 industrial property for rent in Svendborg, Funen
- Ca. 30,000 DKK per month
- Ca. 550 DKK /m2/year
-
Ca. 635 m2 office space for rent in Svendborg, Funen
- Ca. 34,300 DKK per month
- Ca. 650 DKK /m2/year
-
Ca. 130 m2 warehouse for rent in Svendborg, Funen
- Ca. 3,500 DKK per month
- Ca. 350 DKK /m2/year
-
Ca. 635 m2 office space for rent in Svendborg, Funen
- Ca. 18,550 DKK per month
- Ca. 350 DKK /m2/year
-
Ca. 735 m2 office space for rent in Svendborg, Funen
- Ca. 21,400 DKK per month
- Ca. 350 DKK /m2/year
-
Ca. 155 m2 shop for rent in Svendborg, Funen
- Ca. 15,000 DKK per month
- Ca. 1,150 DKK /m2/year
-
Ca. 90 m2 shop for rent in Svendborg, Funen
- Ca. 6,500 DKK per month
- Ca. 900 DKK /m2/year
-
Ca. 245 m2 shop for rent in Svendborg, Funen
- Ca. 19,000 DKK per month
- Ca. 950 DKK /m2/year
-
Ca. 600 m2 shop for rent in Svendborg, Funen
- Ca. 35,000 DKK per month
- Ca. 700 DKK /m2/year
-
Ca. 630 m2 shop for rent in Svendborg, Funen
- Ca. 37,500 DKK per month
- Ca. 700 DKK /m2/year
-
Ca. 165 m2 shop for rent in Svendborg, Funen
- Ca. 11,000 DKK per month
- Ca. 800 DKK /m2/year
-
Ca. 205 m2 shop for rent in Svendborg, Funen
- Ca. 19,650 DKK per month
- Ca. 1,150 DKK /m2/year
Statistics on the development of available commercial real estate for rent in Svendborg over the past month
Also see aggregate statistics on all available commercial rentals in Svendborg over time, aggregate statistics on new commercial rentals in Svendborg over time, aggregate statistics on rented commercial real estate in Svendborg over time
| Date | |||
|---|---|---|---|
| 7. February 2026 | 138 | 1 | 0 |
| 6. February 2026 | 137 | 0 | 0 |
| 5. February 2026 | 137 | 0 | 0 |
| 4. February 2026 | 137 | 1 | 0 |
| 3. February 2026 | 136 | 0 | 0 |
| 2. February 2026 | 136 | 7 | 0 |
| 1. February 2026 | 129 | 0 | 7 |
| 31. January 2026 | 136 | 1 | 2 |
| 30. January 2026 | 137 | 2 | 0 |
| 29. January 2026 | 135 | 0 | 3 |
| 28. January 2026 | 138 | 0 | 1 |
| 27. January 2026 | 139 | 0 | 1 |
| 26. January 2026 | 140 | 0 | 0 |
| 25. January 2026 | 140 | 0 | 0 |
| 24. January 2026 | 140 | 0 | 0 |
| 23. January 2026 | 140 | 1 | 1 |
| 22. January 2026 | 140 | 2 | 2 |
| 21. January 2026 | 140 | 2 | 4 |
| 20. January 2026 | 142 | 1 | 1 |
| 19. January 2026 | 142 | 3 | 1 |
| 18. January 2026 | 140 | 0 | 2 |
| 17. January 2026 | 142 | 2 | 0 |
| 16. January 2026 | 140 | 1 | 5 |
| 15. January 2026 | 144 | 1 | 1 |
| 14. January 2026 | 144 | 1 | 0 |
| 13. January 2026 | 143 | 0 | 0 |
| 12. January 2026 | 143 | 3 | 0 |
| 11. January 2026 | 140 | 1 | 4 |
| 10. January 2026 | 143 | 1 | 0 |
| 9. January 2026 | 142 | 3 | 3 |
| 8. January 2026 | 142 | 0 | 0 |
Statistics on currently available commercial spaces in Svendborg in Denmark
Also see gathered statistics of all available commercial space in Svendborg over time, the gathered statistics of new commercial space in Svendborg over time, the gathered statistics of rented commercial space in Svendborg over time
| Total | |
|---|---|
| Available premises | 117 |
| New premises since yesterday | 1 |
| Rented out premises since yesterday | 0 |
| Total available m2 | 78,569 |
| Average price per m2 per year without expenses | 173 |
| Highest price per m2 per year | 2,204 |
| Lowest price per m2 per year | 9 |


