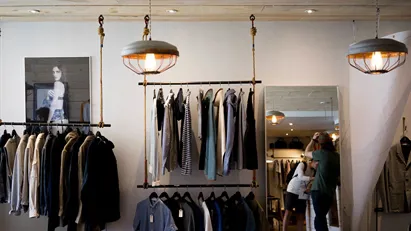
Available shops in Greater Copenhagen
See all available shops in Greater Copenhagen below. If you are looking for shop in Greater Copenhagen, you have come to the right place. We have most available shops in Greater Copenhagen in our database. Find shop in Greater Copenhagen here. Enjoy.
586 shops found
-
Ca. 1,125 m2 shop for rent in Copenhagen K, Copenhagen
- Ca. 716,850 DKK per month
- Ca. 7,650 DKK /m2/year
-
Ca. 90 m2 shop for rent in Søborg, Greater Copenhagen
- Ca. 14,650 DKK per month
- Ca. 2,000 DKK /m2/year
-
Ca. 150 m2 office space for rent in Bagsværd, Greater Copenhagen
- Ca. 10,000 DKK per month
- Ca. 800 DKK /m2/year
-
Ca. 425 m2 shop for rent in Vesterbro, Copenhagen
- Ca. 97,850 DKK per month
- Ca. 2,750 DKK /m2/year
-
Ca. 235 m2 shop for rent in Vesterbro, Copenhagen
- Ca. 78,350 DKK per month
- Ca. 4,000 DKK /m2/year
-
Ca. 310 m2 shop for rent in Copenhagen SV, Copenhagen
- Ca. 38,750 DKK per month
- Ca. 1,500 DKK /m2/year
-
Ca. 55 m2 shop for rent in Nørrebro, Copenhagen
- Ca. 12,000 DKK per month
- Ca. 2,550 DKK /m2/year
-
Ca. 150 m2 shop for rent in Taastrup, Greater Copenhagen
- Ca. 19,100 DKK per month
- Ca. 1,550 DKK /m2/year
-
Ca. 475 m2 shop for rent in Frederiksberg C, Copenhagen
- Ca. 63,750 DKK per month
- Ca. 1,600 DKK /m2/year
-
Ca. 240 m2 shop for rent in Gentofte, Greater Copenhagen
- Ca. 18,000 DKK per month
- Ca. 900 DKK /m2/year
-
Ca. 85 m2 shop for rent in Holte, Greater Copenhagen
- Ca. 30,000 DKK per month
- Ca. 4,350 DKK /m2/year
-
Ca. 80 m2 shop for rent in Copenhagen K, Copenhagen
- Ca. 10,650 DKK per month
- Ca. 1,600 DKK /m2/year
-
Ca. 395 m2 shop for rent in Frederiksberg, Copenhagen
- Ca. 37,850 DKK per month
- Ca. 1,150 DKK /m2/year
Frequently asked questions
Statistics on the development of available shops for rent in Greater Copenhagen over the past month
Also see aggregate statistics on all available shops in Greater Copenhagen over time, aggregate statistics on new shops in Greater Copenhagen over time, aggregate statistics on rented shops in Greater Copenhagen over time
| Date | |||
|---|---|---|---|
| 9. February 2026 | 590 | 0 | 0 |
| 8. February 2026 | 590 | 1 | 2 |
| 7. February 2026 | 591 | 3 | 6 |
| 6. February 2026 | 594 | 5 | 6 |
| 5. February 2026 | 595 | 3 | 1 |
| 4. February 2026 | 593 | 2 | 7 |
| 3. February 2026 | 598 | 5 | 2 |
| 2. February 2026 | 595 | 12 | 0 |
| 1. February 2026 | 583 | 0 | 10 |
| 31. January 2026 | 593 | 2 | 6 |
| 30. January 2026 | 597 | 2 | 0 |
| 29. January 2026 | 595 | 5 | 1 |
| 28. January 2026 | 591 | 3 | 5 |
| 27. January 2026 | 593 | 4 | 2 |
| 26. January 2026 | 591 | 1 | 2 |
| 25. January 2026 | 592 | 2 | 0 |
| 24. January 2026 | 590 | 0 | 2 |
| 23. January 2026 | 592 | 3 | 1 |
| 22. January 2026 | 590 | 3 | 4 |
| 21. January 2026 | 591 | 4 | 0 |
| 20. January 2026 | 587 | 6 | 6 |
| 19. January 2026 | 587 | 0 | 2 |
| 18. January 2026 | 589 | 1 | 2 |
| 17. January 2026 | 590 | 8 | 0 |
| 16. January 2026 | 582 | 3 | 11 |
| 15. January 2026 | 590 | 1 | 0 |
| 14. January 2026 | 589 | 2 | 5 |
| 13. January 2026 | 592 | 9 | 5 |
| 12. January 2026 | 588 | 3 | 0 |
| 11. January 2026 | 585 | 1 | 4 |
| 10. January 2026 | 588 | 4 | 0 |
Statistics on currently available shops in Greater Copenhagen in Denmark
Also see gathered statistics of all available shops in Greater Copenhagen over time, the gathered statistics of new shops in Greater Copenhagen over time, the gathered statistics of rented shops in Greater Copenhagen over time
| Shops | |
|---|---|
| Available premises | 587 |
| New premises since yesterday | 0 |
| Rented out premises since yesterday | 0 |
| Total available m2 | 192,169 |
| Average price per m2 per year without expenses | 405 |
| Highest price per m2 per year | 39,679 |
| Lowest price per m2 per year | 3 |


