


Industrial properties in Padborg
Companyspace.com today:
New today 425
Updated 24h 1,008
Notifications about new companyspaces41
Copenhagen +5
Amsterdam +1
Berlin +3
Brussels +2
Vienna +4
Dublin (county) +19
Warsaw +12
Roma (region) +1
Latest update 4 min ago
Active ads 364,408
10 industrial properties found
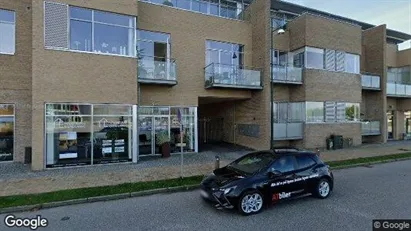
Industrial property in Padborg, Region of Southern Denmark
 More info
Industrial property in Padborg, Region of Southern Denmark
Industrial property for rent in Padborg, Region of Southern Denmark
Areal
Ca. 40 m2
Pris pr. md.
Ca. 84,100 DKK per month
Område
Padborg, Region of Southern Denmark
Type
Industrial property
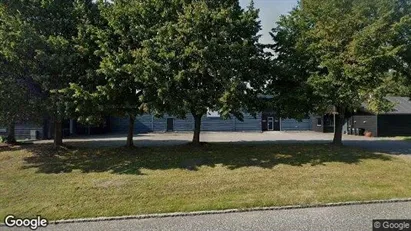
Warehouse in Padborg, Region of Southern Denmark
 More info
Warehouse in Padborg, Region of Southern Denmark
Warehouse for rent in Padborg, Region of Southern Denmark
Areal
Ca. 2,480 m2
Pris pr. md.
Ca. 62,000 DKK per month
Område
Padborg, Region of Southern Denmark
Type
Warehouse
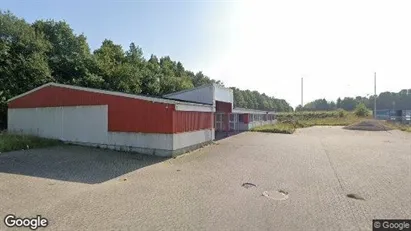
Warehouse in Padborg, Region of Southern Denmark
 More info
Warehouse in Padborg, Region of Southern Denmark
Warehouse for rent in Padborg, Region of Southern Denmark
Areal
Ca. 2,935 m2
Pris pr. md.
Ca. 70,000 DKK per month
Område
Padborg, Region of Southern Denmark
Type
Warehouse
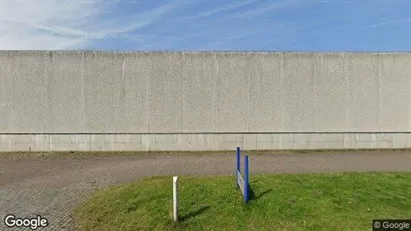
Office space in Padborg, Region of Southern Denmark
 More info
Office space in Padborg, Region of Southern Denmark
Office space for rent in Padborg, Region of Southern Denmark
Areal
Ca. 565 m2
Pris pr. md.
Ca. 22,000 DKK per month
Område
Padborg, Region of Southern Denmark
Type
Office space
Warehouse in Padborg, Region of Southern Denmark
 More info
Warehouse in Padborg, Region of Southern Denmark
Warehouse for rent in Padborg, Region of Southern Denmark
Areal
Ca. 85 m2
Pris pr. md.
Ca. 2,800 DKK per month
Område
Padborg, Region of Southern Denmark
Type
Warehouse
Warehouse property in Padborg, Region of Southern Denmark
 More info
Warehouse property in Padborg, Region of Southern Denmark
Warehouse for sale in Padborg, Region of Southern Denmark
Areal
Ca. 2,000 m2
Pris
Not stated
Område
Padborg, Region of Southern Denmark
Type
Warehouse
Warehouse property in Padborg, Region of Southern Denmark
 More info
Warehouse property in Padborg, Region of Southern Denmark
Warehouse for sale in Padborg, Region of Southern Denmark
Areal
Ca. 2,480 m2
Pris
Not stated
Område
Padborg, Region of Southern Denmark
Type
Warehouse
Warehouse property in Padborg, Region of Southern Denmark
 More info
Warehouse property in Padborg, Region of Southern Denmark
Warehouse for sale in Padborg, Region of Southern Denmark
Areal
Ca. 2,935 m2
Pris
Not stated
Område
Padborg, Region of Southern Denmark
Type
Warehouse
Warehouse property in Padborg, Region of Southern Denmark
 More info
Warehouse property in Padborg, Region of Southern Denmark
Warehouse for sale in Padborg, Region of Southern Denmark
Areal
Ca. 2,000 m2
Pris
Not stated
Område
Padborg, Region of Southern Denmark
Type
Warehouse
Industrial property in Padborg, Region of Southern Denmark
 More info
Industrial property in Padborg, Region of Southern Denmark
Industrial property for sale in Padborg, Region of Southern Denmark
Areal
Ca. 1,395 m2
Pris
Not stated
Område
Padborg, Region of Southern Denmark
Type
Industrial property
Selected customers
Selected customers
30,000 customers use Companyspace.com
30,000 customers
285,000 companies in our database
2,400 rentals annually
Companyspace.com is used by thousands of landlords, property companies, commercial real estate agents, investors and business centres seeking greater visibility, more enquiries and lower vacancy rates.


