


Industrial properties in Odense SØ
Companyspace.com today:
New today 82
Updated 24h 444
Notifications about new companyspaces1,675
Copenhagen +17
Stockholm +2
Vienna +4
Latest update 1 h ago
Active ads 365,341
15 industrial properties found
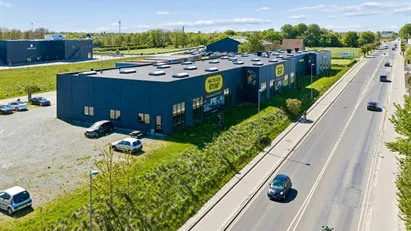
Warehouse in Odense SØ, Odense
More info

Warehouse in Odense SØ, Odense
Warehouse for rent in Odense SØ, Odense
Areal
300 - 1,213 m2
Pris pr. md.
24,833 DKK per month
Område
Odense SØ, Odense
Type
Warehouse
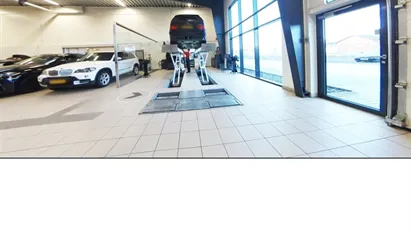
Warehouse in Odense SØ, Odense
More info

Warehouse in Odense SØ, Odense
Warehouse for rent in Odense SØ, Odense
Areal
300 - 1,213 m2
Pris pr. md.
24,833 DKK per month
Område
Odense SØ, Odense
Type
Warehouse
Warehouse in Odense SØ, Odense
 More info
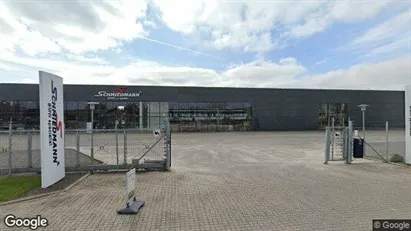
Warehouse in Odense SØ, Odense
Warehouse for rent in Odense SØ, Odense
Areal
300 - 1,213 m2
Pris pr. md.
Ca. 24,850 DKK per month
Område
Odense SØ, Odense
Type
Warehouse
Warehouse in Odense SØ, Odense
More info
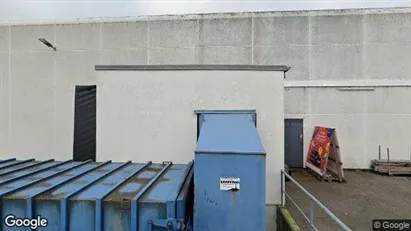
Warehouse in Odense SØ, Odense
Warehouse for rent in Odense SØ, Odense
Areal
300 - 1,213 m2
Pris pr. md.
Ca. 24,850 DKK per month
Område
Odense SØ, Odense
Type
Warehouse
Industrial property in Odense SØ, Odense
 More info
Industrial property in Odense SØ, Odense
Industrial property for rent in Odense SØ, Odense
Areal
Ca. 275 m2
Pris pr. md.
Ca. 17,500 DKK per month
Område
Odense SØ, Odense
Type
Industrial property
Warehouse in Odense SØ, Odense
 More info
Warehouse in Odense SØ, Odense
Warehouse for rent in Odense SØ, Odense
Areal
Ca. 230 m2
Pris pr. md.
Ca. 9,450 DKK per month
Område
Odense SØ, Odense
Type
Warehouse
Warehouse in Odense SØ, Odense
More info
Warehouse in Odense SØ, Odense
Warehouse for rent in Odense SØ, Odense
Areal
Ca. 280 m2
Pris pr. md.
Ca. 11,450 DKK per month
Område
Odense SØ, Odense
Type
Warehouse
Warehouse in Odense SØ, Odense
 More info
Warehouse in Odense SØ, Odense
Warehouse for rent in Odense SØ, Odense
Areal
Ca. 1,155 m2
Pris pr. md.
Ca. 37,500 DKK per month
Område
Odense SØ, Odense
Type
Warehouse
Industrial property in Odense SØ, Odense
 More info
Industrial property in Odense SØ, Odense
Industrial property for rent in Odense SØ, Odense
Areal
Ca. 275 m2
Pris pr. md.
Ca. 17,500 DKK per month
Område
Odense SØ, Odense
Type
Industrial property
Industrial property in Odense SØ, Odense
 More info
Industrial property in Odense SØ, Odense
Industrial property for rent in Odense SØ, Odense
Areal
Ca. 1,195 m2
Pris pr. md.
Ca. 47,200 DKK per month
Område
Odense SØ, Odense
Type
Industrial property
Warehouse in Odense SØ, Odense
 More info
Warehouse in Odense SØ, Odense
Warehouse for rent in Odense SØ, Odense
Areal
Ca. 4,000 m2
Pris pr. md.
Not stated
Område
Odense SØ, Odense
Type
Warehouse
Warehouse property in Odense SØ, Odense
 More info
Warehouse property in Odense SØ, Odense
Warehouse for sale in Odense SØ, Odense
Areal
Ca. 1,255 m2
Pris
Not stated
Område
Odense SØ, Odense
Type
Warehouse
Industrial property in Odense SØ, Odense
 More info
Industrial property in Odense SØ, Odense
Industrial property for sale in Odense SØ, Odense
Areal
Ca. 115 m2
Pris
Not stated
Område
Odense SØ, Odense
Type
Industrial property
Industrial property in Odense SØ, Odense
 More info
Industrial property in Odense SØ, Odense
Industrial property for sale in Odense SØ, Odense
Areal
Ca. 2,300 m2
Pris
Not stated
Område
Odense SØ, Odense
Type
Industrial property
Industrial property in Odense SØ, Odense
 More info
Industrial property in Odense SØ, Odense
Industrial property for sale in Odense SØ, Odense
Areal
Ca. 1,165 m2
Pris
Not stated
Område
Odense SØ, Odense
Type
Industrial property
Selected customers
Selected customers
30,000 customers use Companyspace.com
30,000 customers
285,000 companies in our database
2,400 rentals annually
Companyspace.com is used by thousands of landlords, property companies, commercial real estate agents, investors and business centres seeking greater visibility, more enquiries and lower vacancy rates.


