


Industrial properties in Greve
Companyspace.com today:
New today 2,899
Updated 24h 3,921
Notifications about new companyspaces1,862
Copenhagen +2
Stockholm +1
Amsterdam +3
Berlin +3
Vienna +6
Paris +5
Madrid +4
Dublin (county) +23
Warsaw +19
Greater London +13
Latest update 48 min ago
Active ads 369,114
20 industrial properties found
Office space in Greve, Greater Copenhagen
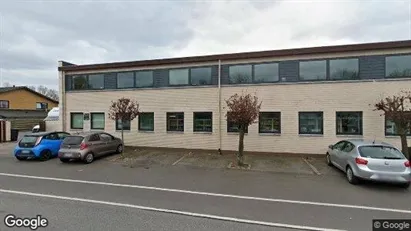 More info
Office space in Greve, Greater Copenhagen
Office space for rent in Greve, Greater Copenhagen
Areal
Ca. 220 m2
Pris pr. md.
Ca. 16,050 DKK pr md
Område
Greve, Greater Copenhagen
Type
Office space
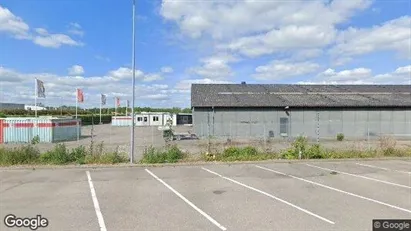
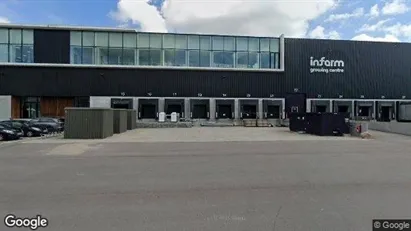
Warehouse in Greve, Greater Copenhagen
 More info
Warehouse in Greve, Greater Copenhagen
Warehouse for rent in Greve, Greater Copenhagen
Areal
Ca. 13,600 m2
Pris pr. md.
Ca. 961,850 DKK pr md
Område
Greve, Greater Copenhagen
Type
Warehouse
Warehouse in Greve, Greater Copenhagen
 More info
Warehouse in Greve, Greater Copenhagen
Warehouse for rent in Greve, Greater Copenhagen
Areal
Ca. 5,000 m2
Pris pr. md.
Ca. 333,350 DKK pr md
Område
Greve, Greater Copenhagen
Type
Warehouse
Warehouse in Greve, Greater Copenhagen
 More info
Warehouse in Greve, Greater Copenhagen
Warehouse for rent in Greve, Greater Copenhagen
Areal
Ca. 12,935 m2
Pris pr. md.
Ca. 862,200 DKK pr md
Område
Greve, Greater Copenhagen
Type
Warehouse
Warehouse in Greve, Greater Copenhagen
 More info
Warehouse in Greve, Greater Copenhagen
Warehouse for rent in Greve, Greater Copenhagen
Areal
Ca. 700 m2
Pris pr. md.
Ca. 35,400 DKK pr md
Område
Greve, Greater Copenhagen
Type
Warehouse
Warehouse in Greve, Greater Copenhagen
 More info
Warehouse in Greve, Greater Copenhagen
Warehouse for rent in Greve, Greater Copenhagen
Areal
Ca. 5,000 m2
Pris pr. md.
Ca. 312,500 DKK pr md
Område
Greve, Greater Copenhagen
Type
Warehouse
Warehouse in Greve, Greater Copenhagen
 More info
Warehouse in Greve, Greater Copenhagen
Warehouse for rent in Greve, Greater Copenhagen
Areal
Ca. 13,325 m2
Pris pr. md.
Ca. 917,850 DKK pr md
Område
Greve, Greater Copenhagen
Type
Warehouse
Industrial property in Greve, Greater Copenhagen
More info
We monitor the market!
Industrial property in Greve, Greater Copenhagen
Industrial property for rent in Greve, Greater Copenhagen
Areal
Ca. 215 m2
Pris pr. md.
Ca. 168,900 DKK pr md
Område
Greve, Greater Copenhagen
Type
Industrial property
Industrial property in Greve, Greater Copenhagen
More info
We monitor the market!
Industrial property in Greve, Greater Copenhagen
Industrial property for rent in Greve, Greater Copenhagen
Areal
Ca. 145 m2
Pris pr. md.
Ca. 116,400 DKK pr md
Område
Greve, Greater Copenhagen
Type
Industrial property
Industrial property in Greve, Greater Copenhagen
More info
We monitor the market!
Industrial property in Greve, Greater Copenhagen
Industrial property for rent in Greve, Greater Copenhagen
Areal
Ca. 145 m2
Pris pr. md.
Ca. 101,500 DKK pr md
Område
Greve, Greater Copenhagen
Type
Industrial property
Warehouse in Greve, Greater Copenhagen
 More info
Warehouse in Greve, Greater Copenhagen
Warehouse for rent in Greve, Greater Copenhagen
Areal
Ca. 10,000 m2
Pris pr. md.
Not stated
Område
Greve, Greater Copenhagen
Type
Warehouse
Warehouse in Greve, Greater Copenhagen
 More info
Warehouse in Greve, Greater Copenhagen
Warehouse for rent in Greve, Greater Copenhagen
Areal
Ca. 20 m2
Pris pr. md.
Not stated
Område
Greve, Greater Copenhagen
Type
Warehouse
Warehouse property in Greve, Greater Copenhagen
 More info
Warehouse property in Greve, Greater Copenhagen
Warehouse for sale in Greve, Greater Copenhagen
Areal
Ca. 100 m2
Pris
Not stated
Område
Greve, Greater Copenhagen
Type
Warehouse
Warehouse in Greve, Greater Copenhagen
 More info
Warehouse in Greve, Greater Copenhagen
Warehouse for rent in Greve, Greater Copenhagen
Areal
Ca. 6,000 m2
Pris pr. md.
Not stated
Område
Greve, Greater Copenhagen
Type
Warehouse
Warehouse in Greve, Greater Copenhagen
 More info
Warehouse in Greve, Greater Copenhagen
Warehouse for rent in Greve, Greater Copenhagen
Areal
Ca. 10,000 m2
Pris pr. md.
Not stated
Område
Greve, Greater Copenhagen
Type
Warehouse
Warehouse in Greve, Greater Copenhagen
More info
We monitor the market!
Warehouse in Greve, Greater Copenhagen
Warehouse for rent in Greve, Greater Copenhagen
Areal
Ca. 3,550 m2
Pris pr. md.
Not stated
Område
Greve, Greater Copenhagen
Type
Warehouse
Industrial property in Greve, Greater Copenhagen
More info
We monitor the market!
Industrial property in Greve, Greater Copenhagen
Industrial property for rent in Greve, Greater Copenhagen
Areal
Ca. 5,865 m2
Pris pr. md.
Not stated
Område
Greve, Greater Copenhagen
Type
Industrial property
Warehouse in Greve, Greater Copenhagen
More info
We monitor the market!
Warehouse in Greve, Greater Copenhagen
Warehouse for rent in Greve, Greater Copenhagen
Areal
Ca. 3,660 m2
Pris pr. md.
Not stated
Område
Greve, Greater Copenhagen
Type
Warehouse
Selected customers
30,000 customers use Companyspace.com
30,000 customers
285,000 companies in our database
2,400 rentals annually
Companyspace.com is used by thousands of landlords, property companies, commercial real estate agents, investors and business centres seeking greater visibility, more enquiries and lower vacancy rates.


